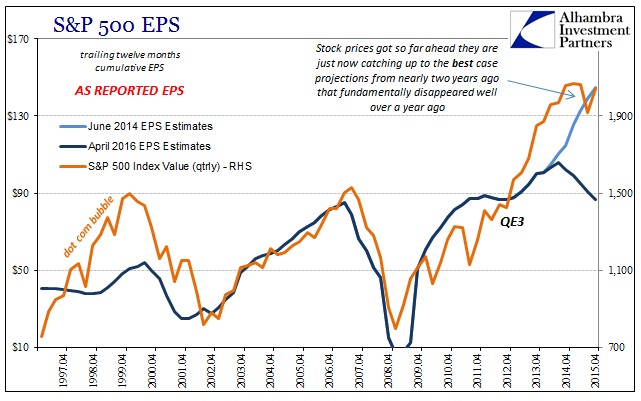
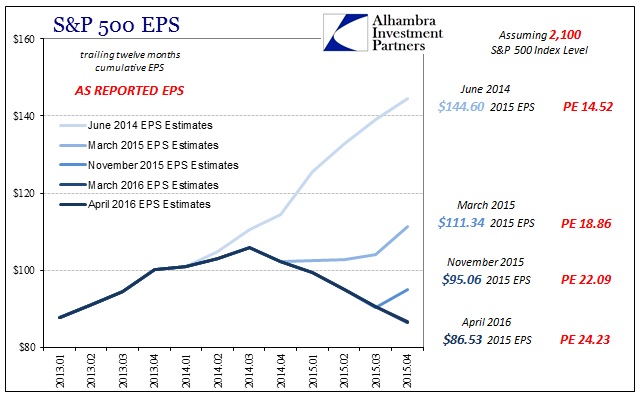
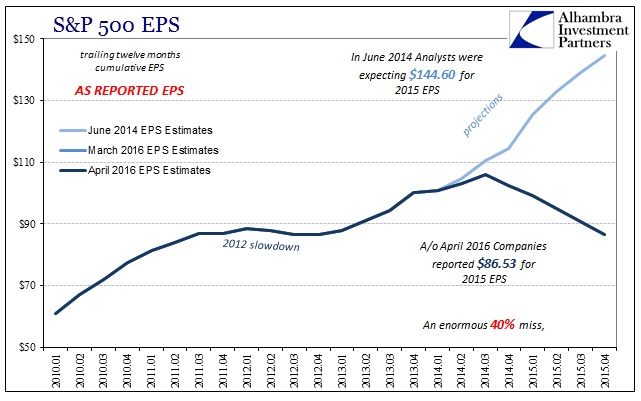
As the major stock indices overtake or threaten psychological round numbers again (S&P 500 2,100; DJIA 18,000), they have done so with the same problem as occurred in 2015. Stocks have been overvalued for some time in historical comparison especially after QE3 and QE4, but it was supposed to be in anticipation of the full recovery that QE would make. For the longest time, that narrative actually seemed plausible at least in earnings. In June 2014, analysts estimated that total as-reported earnings for the calendar year of 2015 would close out around $144 per share. At an index level of 2,100, it would represent a seemingly low valuation multiple of 14.5 (low because, we were told, low discounting from historically low interest rates, favorable fixed income comparisons, and then high expected growth especially in areas like tech and consumer-related industries).
Analysts’ estimates are always overly optimistic and have the hardened habit of being lowered as each particular quarter draws closer, but what happened with 2015 was something else entirely. Instead of $144 per share, 2015 ttm EPS for the index is going to be about $86.50. Rather than leave stock investors assured in their valuations, it meant the S&P 500 was trading around 24 times actual EPS. Worse, than that, the downdraft in earnings wasn’t apparent to analysts until it actually happened (believing in “transitory” as they did) and companies reported.
As late as March 2015, analysts had been mugged by the events of late 2014 and the first parts of last year but were still predicting that earnings would grow by about 9% for the full year, including a return to “normal” growth by Q4. Even in November 2015, though the downtrend had been established in almost perfect uniformity, analysts were still expecting Q4 and then Q1 2016 to start a very strong turnaround.
From that perspective you can understand why stock investors suddenly became more than a little nervous where only certainty and confidence had existed. On the whole, it was figured that the economy would provide a solid if not historically so valuation floor for stocks that would be pushed up relentlessly by the recovery that economists and the FOMC were describing all the way into the middle of 2015 – only to find by the end of the year that the stock market may have been overvalued by as much as 40% to actual earnings (assuming a multiple of 15 represents “fair value”).
As optimism returns again, all that nasty business and “unexpected” uncertainty is being left behind as nothing more than scholarly conjecture suitable only for historians; 2016 is again on the march, or so it might seem. The surge in stocks during this “dollar” interregnum seems to be (outside of raw momentum and risk chasing) resurrecting the same assumptions as early 2015. “Transitory” has regained form only refashioned from a few months deviation to more than a year – but still to the same effect with only a delay in reaching the long-promised recovery.
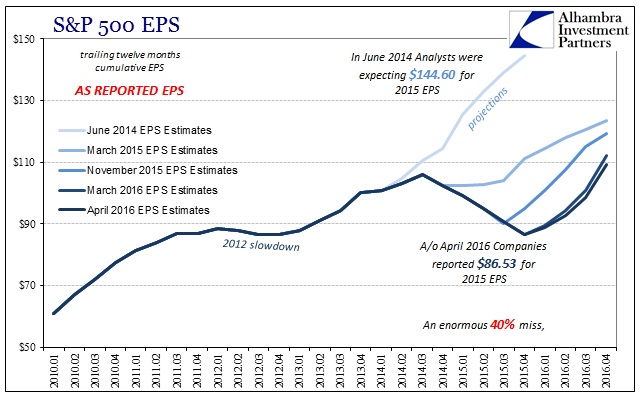
Reality still intrudes, however, on two fronts. Despite analysts’ renewed faith (which sets aside all doubts that should have been their working guesses this whole time) in where earnings will fly in 2016 that still doesn’t recreate the recovery that was once the hardened baseline for projections. The current ttm EPS for 2016 is not even $110 whereas last year was supposed to be $144. It is a huge disappointment even though in relative circumstances $110 is better than $86 – and that is where the focus has returned though it should remain on the recovery’s now nearing permanent disappointment (and thus overvaluation).
The second problem is the familiar downgrade which is already severe, more so than “usual” (though less, so far, than 2015). In other words, $110 may be better than $86 but a year ago it was thought to be $124. The difference in valuation is again quite striking.
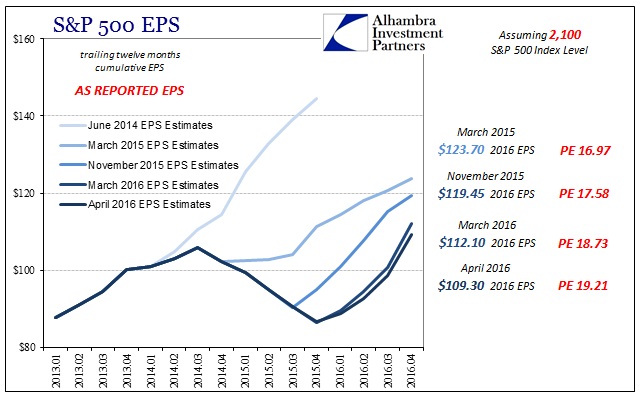
A forward PE using March 2015 estimates would have been somewhat expensive at about 17 times earnings but is already now more than 19 even as EPS continues to fall. Over just the last month (March to April), 2016 ttm EPS has dropped by almost $3 which again suggests that when all is completed this year a multiple of 19 will be almost certainly the best and least likely case. That would mean the assumed valuation floor is far lower for a second consecutive year, and we still have no idea just how low it may yet reach.
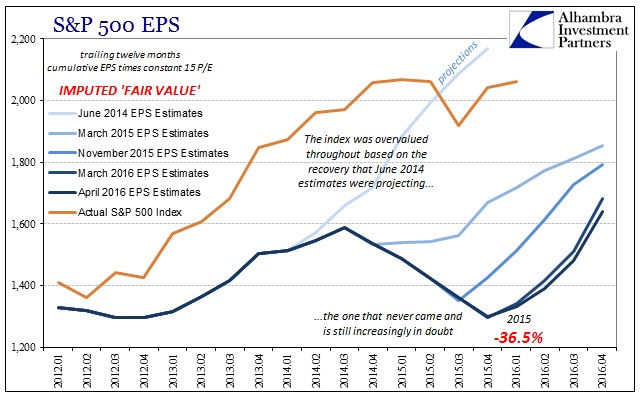
Where the S&P 500 may have been overvalued by perhaps 40% or more based on actual, as-reported 2015 EPS, the current annual EPS estimates suggest only a return to the 1,600 range not 2,100 or better (for the full year 2016 EPS; current estimates still plug “fair value” as something like 1,330 on the index meaning it will take a surge in earnings growth later this year just to get “fair value” back to 1,600!). As you can plainly observe above, had the 2014 version of recovery worked out the actual trajectory of the index would have been at “fair value” (though in this counterfactual it is very likely that the index and all stocks would have kept going up and up rather than sideways to lower these past nearly two years now) or close to it. Instead, the “transitory” weakness in 2015 has opened a gulf that only entrenches the high degree of overvaluation even under scenarios where 2016 isn’t so bad. That would leave stocks especially vulnerable to any further swings in sentiment as the assumed valuation “floor” quite “unexpectedly” remains quite distant.
While momentum and risk chasing take about pushing the various indices in the near term, longer term (actual) investors will be forced to reckon with this huge disparity – that prices surged after QE4 in anticipation of the recovery happening and justifying what would have been only temporary overvaluation due to the giddiness of actual discounting. The fact that earnings are now nowhere near vindicating those expectations is a fundamentally different proposition altogether, including that QE was itself a lie. I believe it is this incongruence that explains the very curious and conspicuous sideways behavior in stocks as remnants of the old QE-driven hopes remain but are no longer in such unison or enjoy such widespread support.
Doubt is the operative condition now, though especially variable in its short run expressions. It is in shorter supply today but that is no more the case than November 3 when the S&P last closed above 2,100 (just days before more “unexpected” hit) or even August 17 with the S&P 500 at 2,102 and already a week past the great Chinese warning of the intensified “dollar” run and only a week before the mini-crash of August 24 that run fulfilled. Even if the events of 2015 and early 2016 turn out to be the end of it, it still means that full recovery in earnings and the real economy has been pushed several years farther into the future – a far more precarious state than was believed to ever be truly possible. To figure, then, that there is now much, much more than a trivial chance of still more disruption and contraction does not mix well with such durable overvaluation.