
“Predictions Are Difficult…Especially When They Are About The Future” – Niels Bohr
We can’t predict the future. If it could, fortune tellers would win all of the lotteries. They don’t, we can’t, and we are not going to try to.
However, we can analyze what has happened in the past, weed through the noise of the present, and try to discern the possible outcomes of the future.
The biggest problem with Wall Street, both today and in the past, is the consistent disregard of the unexpected and random events they inevitability occur.
In a 2010 study, by the McKinsey Group, they found that analysts have been persistently overly optimistic for 25 years. During the 25-year time frame Wall Street analysts pegged earnings growth at 10-12% a year. Unfortunately, earnings only grew at 6% which, as we have discussed in the past, is the growth rate of the economy. Ed Yardeni published the two following charts which show that analysts are always overly optimistic in their estimates.
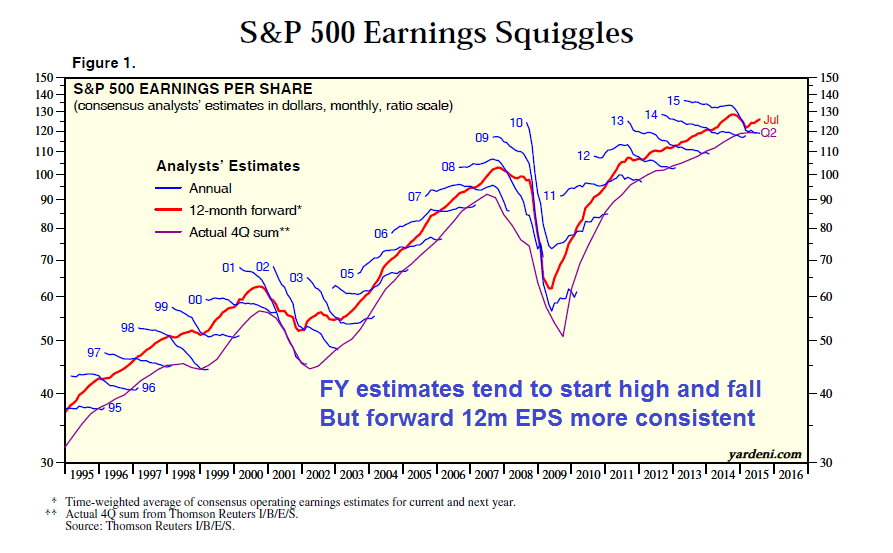
This is why using forward earnings estimates as a valuation metric is so incredibly flawed as estimates are always overly optimistic.
Furthermore, the reason that earnings only grew at 6% over the last 25 years is because the companies that make up the stock market are a reflection of real economic growth. Stocks cannot outgrow the economy over the long term…remember that.
The McKenzie study also noted that on average “analysts’ forecasts have been almost 100% too high” which leads investors to make much more aggressive bets on the financial markets.
Of course, Wall Street is a group of highly conflicted, marketing and PR firms which are hired by companies to “market” for them to increase the value of their stock. This, in turn, raises the executive pay tied to stock-based compensation.
The Wall Street Journal confirmed as much in a 2012 article entitled “Earnings Wizardry” which stated:
“If you believe a recent academic study, one out of five [20%] U.S. finance chiefs have been scrambling to fiddle with their companies’ earnings. Not Enron-style, fraudulent fiddles, mind you. More like clever—and legal—exploitations of accounting standards that ‘manage earnings to misrepresent [the company’s] economic performance,’ according to the study’s authors, Ilia Dichev and Shiva Rajgopal of Emory University and John Graham of Duke University. Lightly searing the books rather than cooking them, if you like.”
This should not come as a major surprise as it is a rather “open secret.” Companies manipulate bottom line earnings by utilizing “cookie-jar” reserves, heavy use of accruals, and other accounting instruments to either flatter, or depress, earnings.
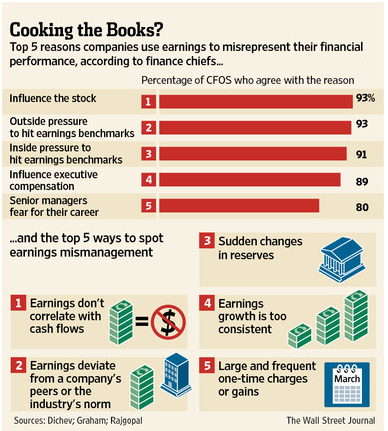
“The tricks are well-known: A difficult quarter can be made easier by releasing reserves set aside for a rainy day or recognizing revenues before sales are made, while a good quarter is often the time to hide a big ‘restructuring charge’ that would otherwise stand out like a sore thumb.What is more surprising though is CFOs’ belief that these practices leave a significant mark on companies’ reported profits and losses. When asked about the magnitude of the earnings misrepresentation, the study’s respondents said it was around 10% of earnings per share.”
Of course, the reason that companies do this is simple: stock-based compensation. Today, more than ever, many corporate executives have a large percentage of their compensation tied to company stock performance. A “miss” of Wall Street expectations can lead to a large penalty in the companies stock price.
Therefore, it is not surprising to see 93% of the respondents pointing to “influence on stock price” and “outside pressure” as reasons for manipulating earnings.
Note: For fundamental investors this manipulation of earnings skews valuation analysis particularly with respect to P/E’s, EV/EBITDA, PEG, etc.
This was brought to the fore again recently by the Associated Press in: “Experts Worry That Phony Numbers Are Misleading Investors:”
“Those record profits that companies are reporting may not be all they’re cracked up to be.
As the stock market climbs ever higher, professional investors are warning that companies are presenting misleading versions of their results that ignore a wide variety of normal costs of running a business to make it seem like they’re doing better than they really are.
What’s worse, the financial analysts who are supposed to fight corporate spin are often playing along. Instead of challenging the companies, they’re largely passing along the rosy numbers in reports recommending stocks to investors.“
Here are the key findings of the report:
- Seventy-two percent of the companies reviewed by AP had adjusted profits that were higher than net income in the first quarter of this year.
- For a smaller group of the companies reviewed, 21 percent of the total, adjusted profits soared 50 percent or more over net income. This was true of just 13 percent of the group in the same period five years ago.
- From 2010 through 2014, adjusted profits for the S&P 500 came in $583 billion higher than net income. It’s as if each company in the S&P 500 got a check in the mail for an extra eight months of earnings.
- Fifteen companies with adjusted profits actually had bottom-line losses over the five years. Investors have poured money into their stocks just the same.
- Stocks are getting more expensive. Three years ago, investors paid $13.50 for every dollar of adjusted profits for companies in the S&P 500 index, according to S&P Capital IQ. Now, they’re paying nearly $18.
The problem when it comes to blindly investing in markets without a thorough understanding of underlying dynamics is much the same as playing “leapfrog with a unicorn,” eventually, there is a very negative outcome. While valuations may not matter currently, in hindsight it will become clear that such valuation levels were clearly unsustainable. However, the financial media will report such revelations long after it is of use to anyone.
Of course, Wall Street must have a customer to sell their products to – which would be you. But would you buy something if you thought it was going to lose money? Of course, not.
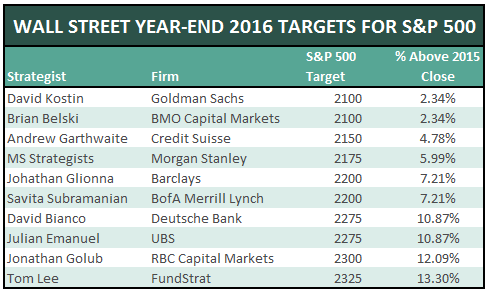
This is WHY Wall Street spends BILLIONS of dollars each year in marketing and advertising trying to keep you invested at all times. And, since optimism is what sells products, it is not surprising, as we head into 2016, to see Wall Street’s average expectation ratcheted up to a 7.7% advance next year.
Of course, comparing your portfolio to the market is a major mistake to begin with. As I have written many times previously:
“Comparison is the cause of more unhappiness in the world than anything else. Perhaps it is inevitable that human beings as social animals have an urge to compare themselves with one another. Maybe it is just because we are all terminally insecure in some cosmic sense. Social comparison comes in many different guises. ‘Keeping up with the Joneses,’ is one well-known way.
If your boss gave you a Mercedes as a yearly bonus, you would be thrilled—right up until you found out everyone else in the office got two cars. Then you are ticked. But really, are you deprived for getting a Mercedes? Isn’t that enough?
Comparison-created unhappiness and insecurity is pervasive, judging from the amount of spam touting various enlargement procedures for males and females. The basic principle seems to be that whatever we have is enough, until we see someone else who has more. Whatever the reason, comparison in financial markets can lead to remarkably bad decisions.
Comparison in the financial arena is the main reason clients have trouble patiently sitting on their hands, letting whatever process they are comfortable with work for them. They get waylaid by some comparison along the way and lose their focus. If you tell a client that they made 12% on their account, they are very pleased. If you subsequently inform them that “everyone else” made 14%, you have made them upset. The whole financial services industry, as it is constructed now, is predicated on making people upset so they will move their money around in a frenzy. Money in motion creates fees and commissions. The creation of more and more benchmarks and style boxes is nothing more than the creation of more things to COMPARE to, allowing clients to stay in a perpetual state of outrage.”
A Note About Risk Management
This is why I manage portfolios from a risk managed basis – greater returns are generated from the management of “risks” rather than the attempt to create returns. My philosophy was well defined by Robert Rubin, former Secretary of the Treasury, when he said;
“As I think back over the years, I have been guided by four principles for decision making. First, the only certainty is that there is no certainty. Second, every decision, as a consequence, is a matter of weighing probabilities. Third, despite uncertainty we must decide and we must act. And lastly, we need to judge decisions not only on the results, but on how they were made.
Most people are in denial about uncertainty. They assume they’re lucky, and that the unpredictable can be reliably forecast. This keeps business brisk for palm readers, psychics, and stockbrokers, but it’s a terrible way to deal with uncertainty. If there are no absolutes, then all decisions become matters of judging the probability of different outcomes, and the costs and benefits of each. Then, on that basis, you can make a good decision.”
It should be obvious that an honest assessment of uncertainty leads to better decisions, but the benefits of Rubin’s approach, and mine, goes beyond that. For starters, although it may seem contradictory, embracing uncertainty reduces risk while denial increases it. Another benefit of acknowledged uncertainty is it keeps you honest.
“A healthy respect for uncertainty and focus on probability drives you never to be satisfied with your conclusions. It keeps you moving forward to seek out more information, to question conventional thinking and to continually refine your judgments and understanding that difference between certainty and likelihood can make all the difference.”
The reality is that we can’t control outcomes; the most we can do is influence the probability of certain outcomes which is why the day to day management of risks and investing based on probabilities, rather than possibilities, is important not only to capital preservation but to investment success over time.
2016 – The Odds Of Positive Year Fall Sharply
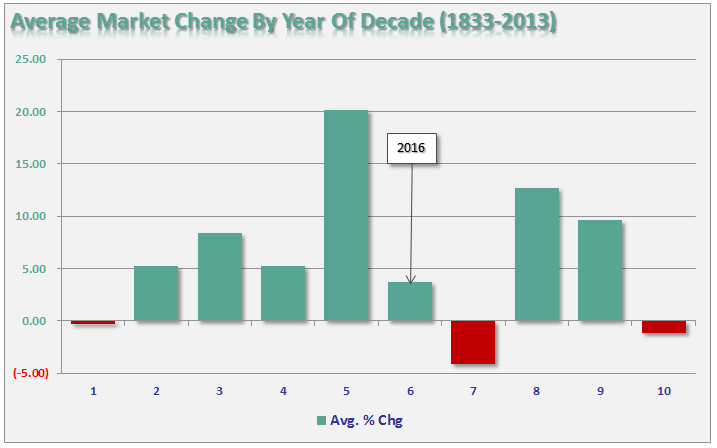
As we enter into the 6th year of the decade, what do the decennial trends tell us about the probabilities of stock market returns in the coming year.
In reviewing 2015, we find that the 5th year of the decade has been positively biased over its history turning in an average return of 20.16% with positive years outnumber losing ones by 15 to 4. 2015 was one of the rare exceptions with the market dropping 2% for the year.
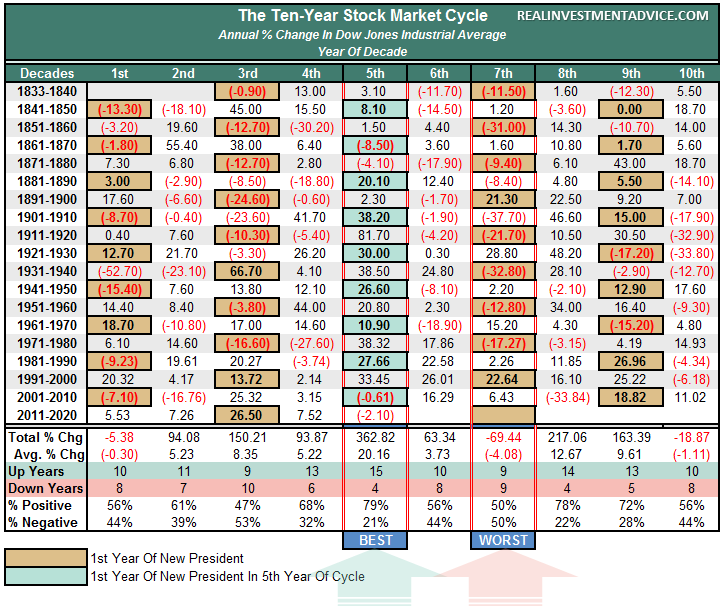
2016 may also continue to be tough sledding as the odds of a positive return year fall from 79% to 56%. Also, the average rate of return falls to just 3.73% which is far below the average expected by Wall Street analysts (above) of 7.7%.
While statistics say that 2016 leans more heavily towards positive returns – the final outcome will have much to do with a common theme you will see throughout this report today – the economic recovery may be over.
More importantly, with the Federal Reserve now tightening monetary policy, versus previous accommodation, the reduction in liquidity will drag multiples in the year ahead.
2016 Outlook & Forecast
Each year, as I prepare to write my outlook and forecast, I read many of the mainstream analyst’s predictions to get a gauge on the “consensus.” This year, more so than most, the outlook for 2016 is universally, and to some degree exuberantly, bullish. What comes to mind is Bob Farrell’s Rule #9 which states:
“When everyone agrees…something else is bound to happen.”
As noted above, the “consensus” suggests that 2016 will be a continuation of the last seven years with respect to rising stock markets with estimates the S&P 500 could top 2300 next year. It is also “hoped” that the economy will return to stronger trends of economic growth to finally achieve “escape velocity” which will lead to real improvements in employment and income growth.
Could such really be the case? Honestly, I don’t know. However, the following are my best “guesses” for the coming year, based on the statistical and technical data trends, for the market, interest rates, the dollar, employment and the economy.
S&P 500 Posts A Negative Return Year
If you take a look around Wall Street, it is hard to find anyone that expects a negative year in 2016. However, bull markets do not last forever and with deteriorating earnings, narrow market breadth and declining momentum, there are ample signs that the first half of this particular market cycle is nearing its end.
As shown in the two charts below, stocks are expensive by any legitimate measure which suggests that annualized rates of return will be low in the future.
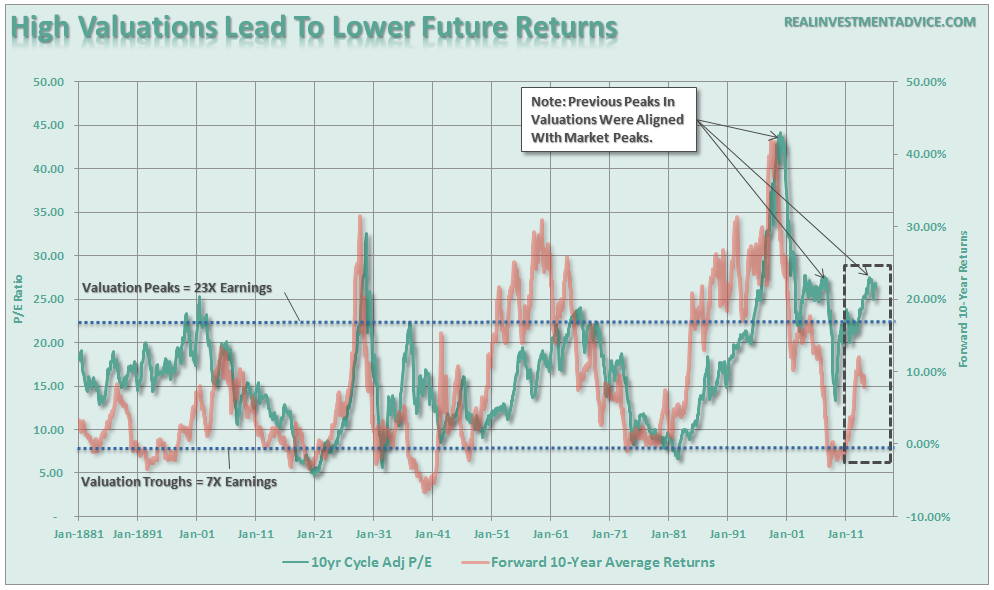
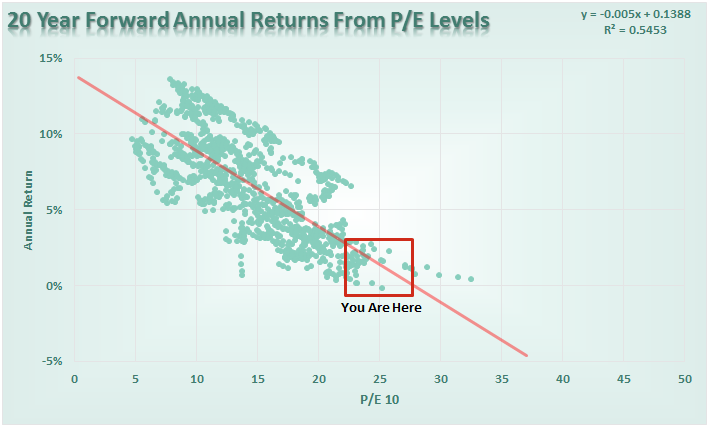
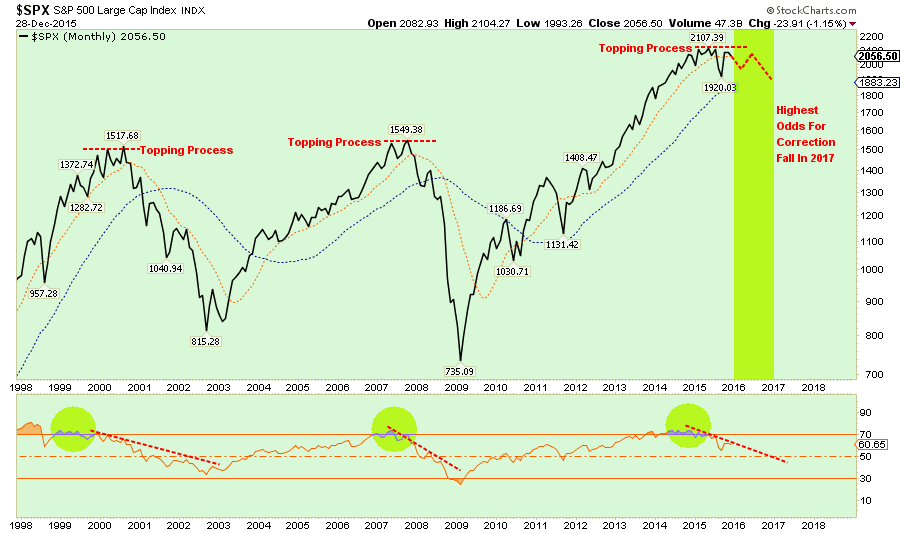
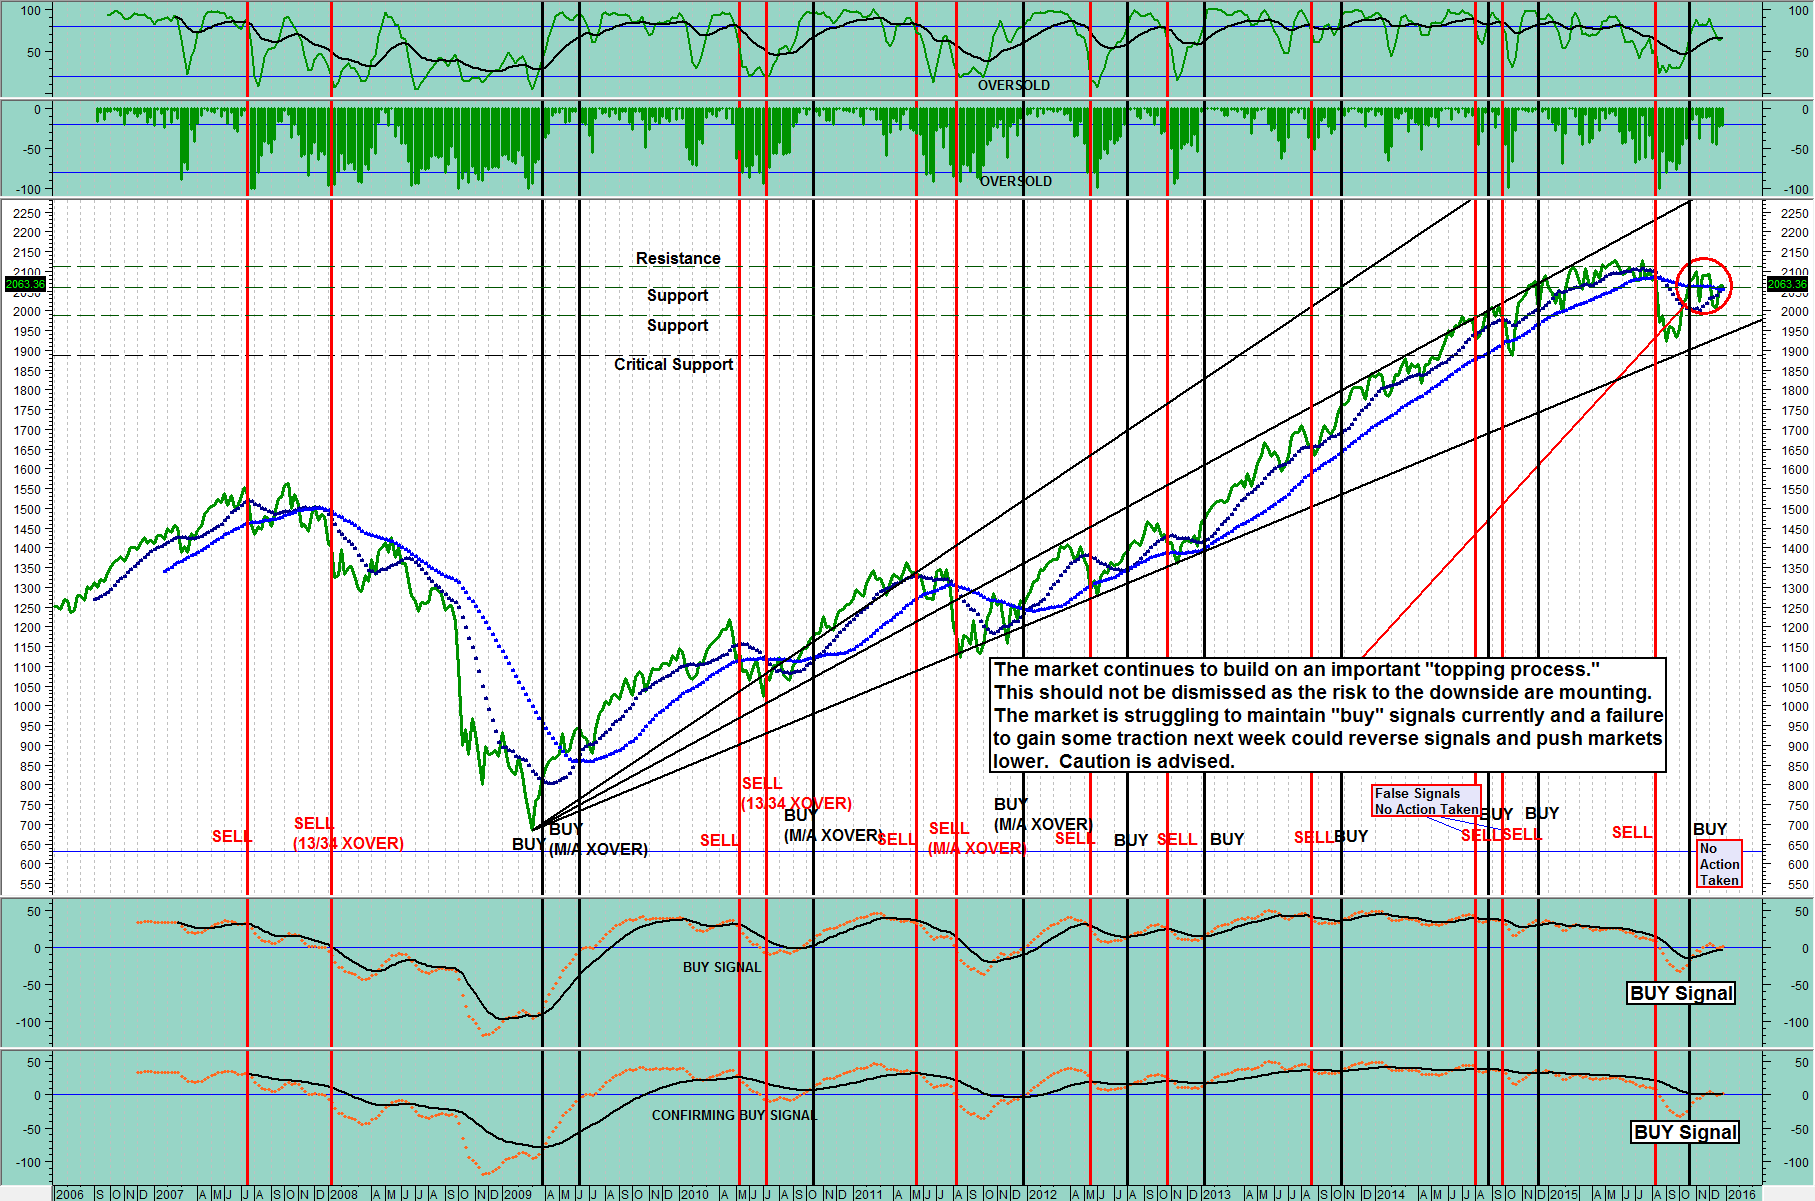
Note that valuations appear to have peaked in the last year which historically has been coincident with market peaks in the past. The next chart shows the many similarities between the current market topping process and the previous two bull-market peaks. With the Federal Reserve now intent on tightening monetary policy in a weak economic growth environment, the odds of a negative return year in 2016 has risen markedly.
However, while 2016 is likely to be a negative return year, it is either late 2016 or early 2017 that the economy slips into a recession and the next major market correction occurs. While that is what the historical statistics suggest, it should be noted that previous market cycles were not operating at the lowest average annual rates of economic growth on record. There are many issues that could advance the recessionary cycle/market reversion into 2016.
International Stocks Drag As Well
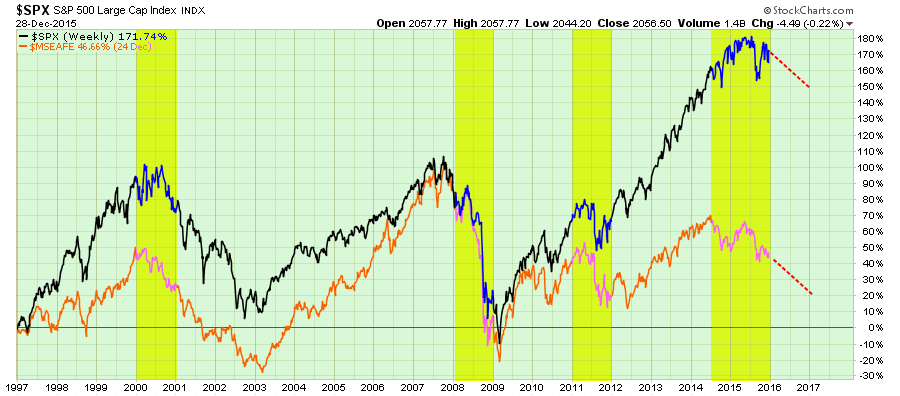
However, it will most likely not be just the S&P 500 that declines in 2016, but industrialized international markets as well. In fact, if history is a guide, the decline in the international markets is already providing a leading indication of a negative return year for the S&P 500. Despite hopes of a stronger economic environment, ongoing liquidity from global Central Banks and negative rates, the reality is that those supports have already been “weighed, measured, and found wanting.”
Interest Rates Decline Below 2%
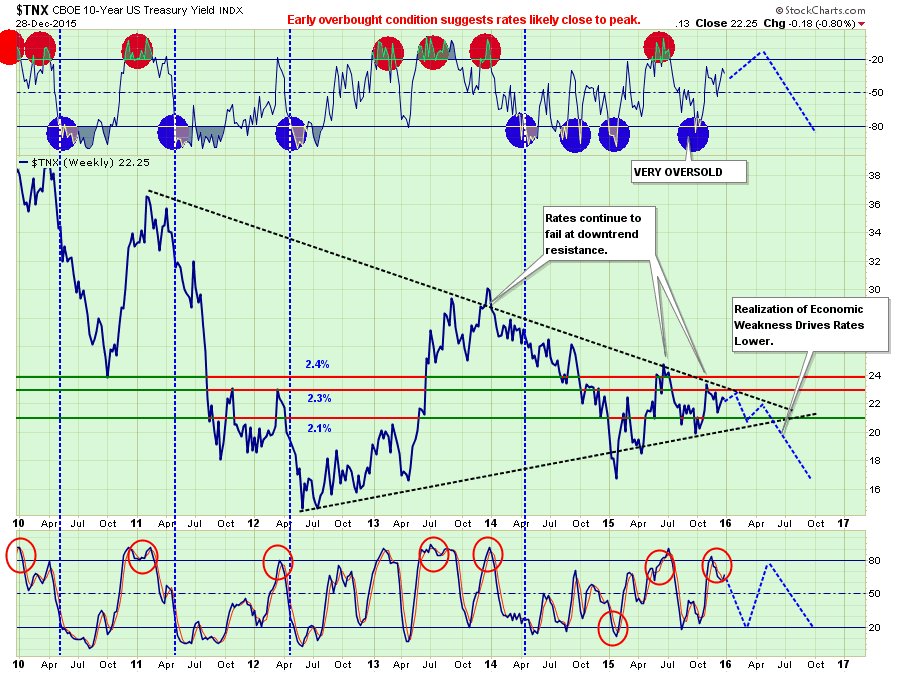
With the Federal Reserve raising interest rates on the short-end (Fed Funds), it will likely push the long-end of the curve lower as the economy begins to slow from the effects of monetary policy tightening.
From a purely technical perspective, rates have been in a long-term process of a tightening wedge. A breakout to the upside would suggest 10-year treasury rates would soar to 3.6% or higher, the consequence of which would be an almost immediate push of an economy growing at 2% into recession. The most likely path, given the current economic and monetary policy backdrop, will be a decline in rates toward the previous lows of 1.6-1.8%. (Inflation will also remain well below the Fed’s 2% target rate for the same reasons.)
If the Fed does indeed follow their determined path to raise the Fed Funds rate by an additional 1% in the coming year, the result will be a nearly flat yield curve which will remove another “leg of support” from the bulls.
Of course, falling rates means the ongoing “bond bull market” will remain intact for another year. In fact, if my outlook is correct, bonds will likely be one of the best performing asset classes in the next year.
Oil / Energy Remains Weak
Unfortunately, while Energy has already been in a bear market over the last year, it will not improve much in the coming year. Around mid-year, the majority of oil price hedges will have expired and the impact of collapsing oil prices will be reflected in two major areas – energy sector profits and energy related debt.
The historical correlation between the commodity price and energy sector is, not surprisingly, very high.
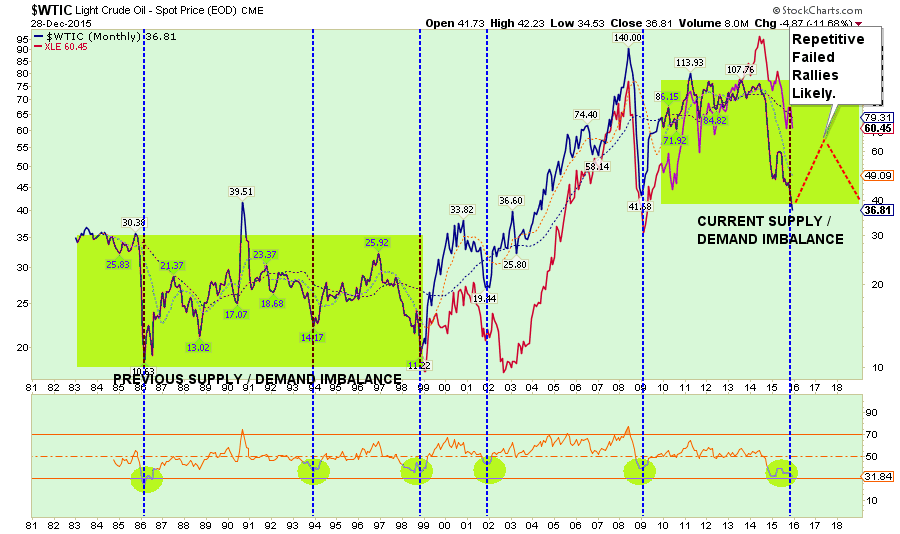
Over the next year, energy prices will likely remain under pressure as the supply of oil continues to outstrip demand.
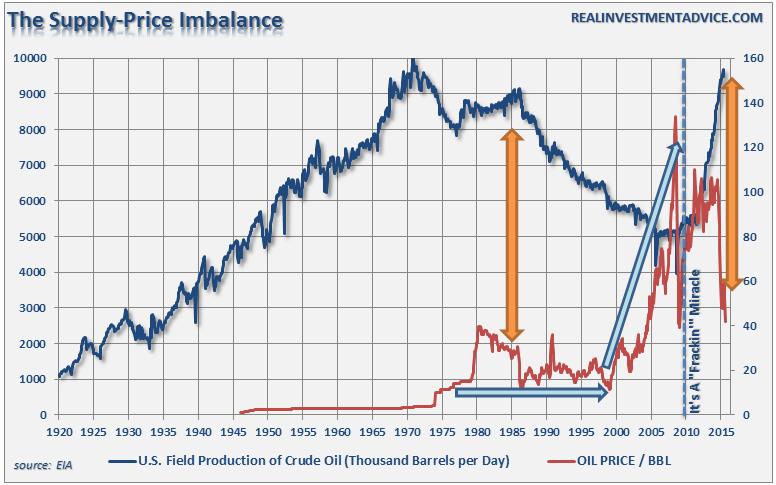
The last time that oil supply was at current levels, oil prices remained mired in a trading range for twenty years. With global growth weak, inflationary pressures low and debt levels at historically high levels, it is unlikely that the resolution of the supply-demand imbalance will be resolved in just a couple of years.
As hedges expire, profits will continue to erode, production will be shut-in, unemployment will rise, CapEx will be cut further and debt-defaults will rise sharply. All of these issues will have broad-reaching economic impacts which will be reflected in weaker rates of economic growth.
MLP Risk: One of the big issues starting in 2016 will be the reversions of MLP’s. Many investors jumped into MLP’s believing them to be a “no-brainer” investment for income with little or no price risk. As I have suggested many times over the last few years, this was ALWAYS a false premise. In 2016, many companies that spun-off pipelines in the form of MLP’s, will “revert” them back into the parent company as they can buy the asset back very cheaply boosting cash flows of the parent company during a period of weak commodity prices. This will leave MLP investors who just “bought it for the dividend,” receiving back much less than they invested to begin with.
The Long Dollar Trade Ends
One of the most “crowded trades” in the market today is the long-dollar trade. Historically speaking, and from a contrarian viewpoint, any time that a trade has become “crowded” it has been near its end. The strong dollar, which has been the result of a global race to the bottom for other currencies, has negatively impacted economic growth in the U.S. as exports have declined.
From a purely technical perspective, as shown in the chart below, there have only been two times previously when the dollar has been as extended as it is currently. Both times those levels marked the peak of the dollar advance.
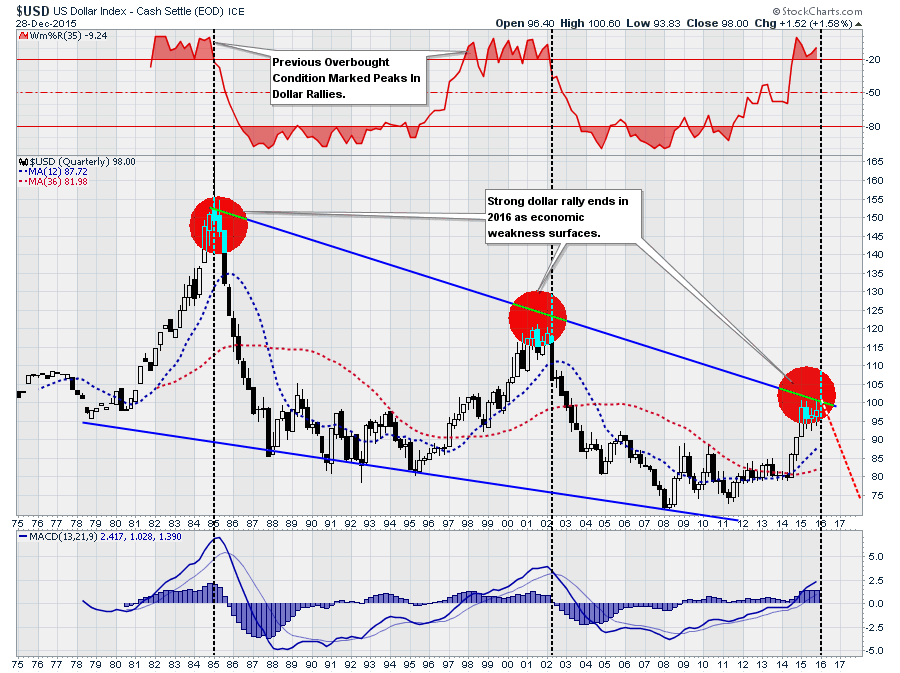
As economic weakness accelerates over the next 12-18 months, due to tighter monetary policies, the dollar will weaken.
Employment Stumbles
As with all things, what goes up will eventually come down. Employment is no exception. While the Federal Reserve has pinned their hopes on persistent employment growth into the infinite future, the reality is the current economic and employment cycle are nearing completion. This is even evident in the Fed’s on Labor Market Conditions Index which they have continued to ignore in order to advance their own policies.
As shown in the chart below, the index peaked earlier this year and has begun to deteriorate. However, I have also noted with vertical lines the points in the past where the Fed has begun hiking interest rates. In all cases, the first rate hike marked the peak in the employment cycle.
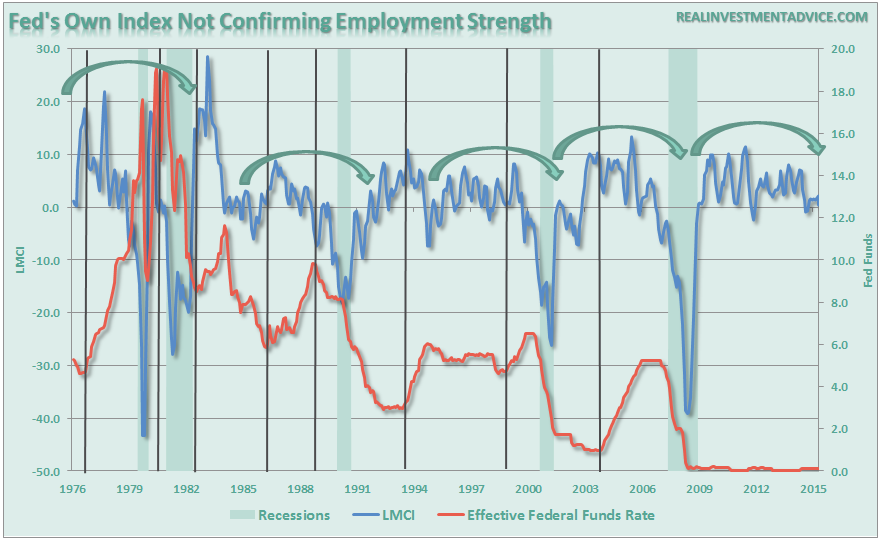
This also coincides with the drop in the employment-t0-population ratio of 16-54-year-olds from its peak in February of this year.
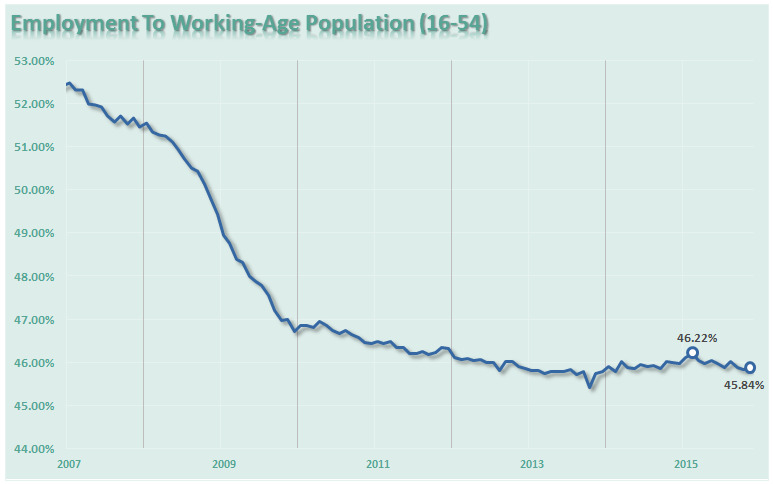
While the Fed continues to look at a very flawed U-3 unemployment report as evidence that the economy is strong enough to withstand higher interest rates, the reality as shown by the labor force participation rate is far different.
As the economy weakens in the coming year due to the continued pressure from the deterioration in the energy sector, weak wage growth and deflationary pressures from abroad; the employment situation will begin to worsen.
Economy Trips
There is something that is extremely important to remember about economic data – it is heavily subject to backward revisions. This is crucial to remember as the majority of mainstream analysts and economists are looking at current economic data and suggesting there is “no risk of recession.” The inherent problem of making investments based on current data, and a complete disregard or economic cycles, is that when the data is revised in the future it will be far too late to react.
The Economic Output Composite Index, which is a very broad measure of economic activity (both service and manufacturing related) currently shows the economy operating at far weaker levels than headlines suggest.
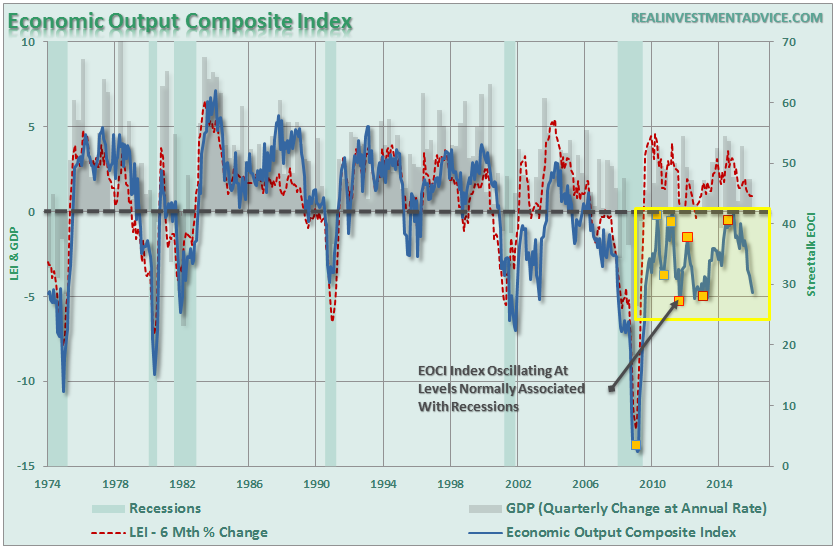
(The EOCI is a weighted composite of the Chicago Fed National Activity Index, Chicago PMI, Regional Fed Manufacturing Surveys, Leading Economic Indicators and the NFIB Small Business Survey.)
The orange squares are the beginning and end points of the Federal Reserve’s Quantitative Easing programs. Notice that economic activity rebounded sharply DURING the QE programs as future activity was pulled forward. Conversely, activity slowed sharply in the absence of that support.
With the Federal Reserve now seemingly convinced the economy is strong enough to stand on its own, there is little likelihood of a QE program coming to pull forward future activity once again.
The current risk is that an economic recession is actually more rapidly approaching than even I suspect. As stated in the section on interest rates above – cash and fixed income (non-high yield) are likely to be the best performing asset classes in the year ahead.
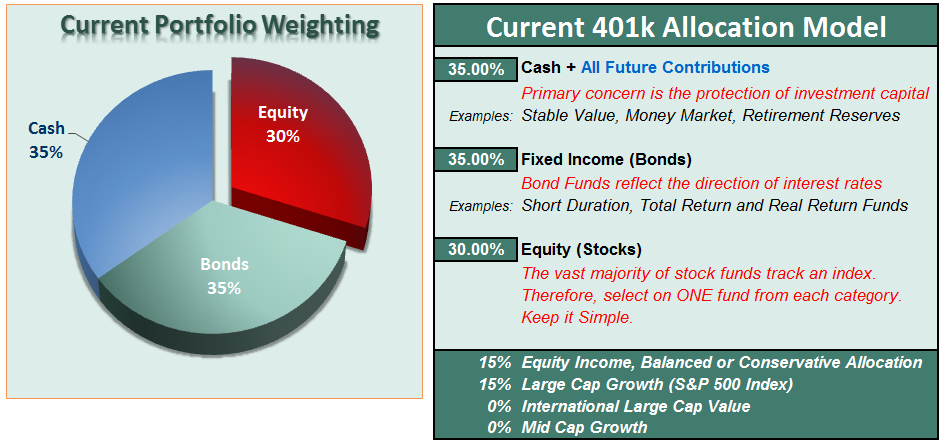
Asset Allocation Model As We Head Into 2016
The following is the recommended asset allocation model currently as we head into 2016. The model is not intended as a “buy and hold” solution, but rather a “risk-managed solution” to allocate and diversify portfolios with.
The first chart shows the history of the model allocation changes since 2007 and the performance measures of that model over time.
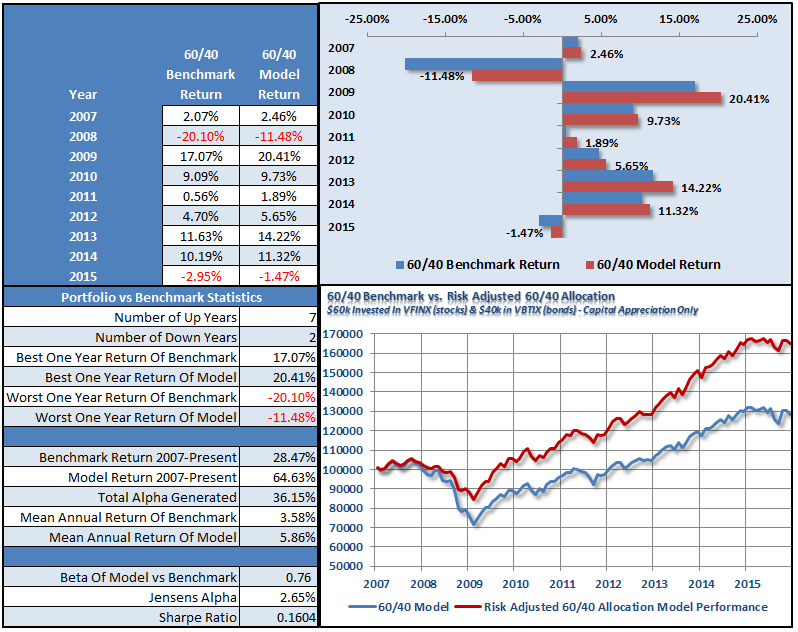
(Disclaimer: This is a hypothetical example for informational and educational purposes only. There are no representations or warranties being made as to actually managed portfolio returns. Past performance is no guarantee of future results. Use all such information at your own risk and peril.)
In April of last year, I recommended reducing equity exposure in portfolios to just 50% of target allocations, removing all Mid-cap and International exposure and overweighting cash. That recommendation has worked out well by shielding portfolios for the downturn this summer and the volatile end of the year.
Heading into 2016, I keeping that allocation intact until I can achieve some clarity as to the markets direction. With the economy weak, profits still deteriorating and deflationary pressures on the rise, there is little reason to take on additional “risk” in portfolios currently.
It is important to remember that portfolio management is not about what happens during the course of a given year but rather the return on assets over a long period of time. For all of the volatility in the markets over the last 15 years, the subsequent returns have been close to 0% after adjusting for inflation. In between, there have been spectacular rises that the media has chided you to buy into. Unfortunately, they sorely missed informing you of the subsequent declines that were just as spectacular and extremely painful.
Conclusion
The common theme throughout the outlook for 2016 is continued weakness in economic growth. The current economic expansion is one of the longest on record, but has also been at the lowest average rate of growth of any cycle on record. This leaves very little room for any type of policy error.
Statistically speaking, the odds suggest that cash and fixed income are likely to provide some of the highest rates of return in the next year barring a complete reversal in monetary policy by the Federal Reserve.
This is not a “bearish forecast.” It is just an assessment of trends, statistics, and probabilities given the current monetary, financial and economic backdrop.
If I am wrong, and stocks do post modest gains in the coming year, being more conservative will only mean a small relative under performance in your portfolio next year.
If I am right, the preservation of capital will be far more beneficial. As I have stated previously, participating in the bull market over the last seven years is only one-half of the job. The other half is keeping those gains during the second half of the full market cycle.
I do not have an enviable job. I am not a fortune teller, or a psychic, but investors always want to believe that I know something that they don’t. This is simply not true.
All I can do is analyze as many of the facts as possible so that you can make your own financial decisions as we head into the coming year.
However, I can tell you this – Wall Street is a massive organization whose business is to sell you product and telling you to get out of the markets is not profitable for them. Therefore, when listening to mainstream analysts and economists make sure and weigh their comments with respect to their financial benefit.
One of my favorite quotes is by Howard Marks and is a principle that we live by in our little shop;
“Resisting – and thereby achieving success as a contrarian – isn’t easy. Things combine to make it difficult; including natural herd tendencies and the pain imposed by being out of step, since momentum invariably makes pro-cyclical actions look correct for a while. (That’s why it’s essential to remember that “being too far ahead of your time is indistinguishable from being wrong.”)
Given the uncertain nature of the future, and thus the difficulty of being confident your position is the right one – especially as price moves against you – it’s challenging to be a lonely contrarian.”
As we enter into 2016 it may pay to be a little more cautious after such a large rise in the financial markets. Think about it this way – if you need to grow your assets by 5% per year from now until retirement, the last 6-years have advanced you more than 20-years towards your goal.
Raising cash and protecting that cushion really shouldn’t be a tough decision. However, not doing it should make you question your own discipline and whether “greed” is overriding your investment logic.
This is where being a contrarian pays off – as long as you have patience.
It is ALWAYS okay to miss out on an opportunity, as opportunity comes along as often as a taxi-cab in New York City. However, it is IMPOSSIBLE to make up losses because you can never regain the time lost getting back to even.
It only took six years for the markets to get back to where they were prior to the financial crisis. It took just about as long to get back to even following the “Dot.com” crash in 2000.
Ladies and gentlemen – getting back to “even” is NOT an investment strategy. It is a game that has been played out since the turn of the century and investors have lost out on time and inflation.
The problem for investors is 15 years to grow and compound your money for retirement is GONE. You can never regain that time. While the financial press is full of hope, optimism and advice that staying fully invested is the only way to win the long-term investing game; the reality is that most won’t live long enough to see that play out.
Being a contrarian is tough. However, sitting on the sidelines when the herd is running to the edge of the cliff is a strategy that will always win in the long term because buying “distressed” and selling “dear” is a strategy that always works.
When in doubt always refer back to Bob Farrell’s 10 Rules:
- Markets tend to return to the mean over time
- Excesses in one direction will lead to an opposite excess in the other direction
- There are no new eras — excesses are never permanent
- Exponential rapidly rising or falling markets usually go further than you think, but they do not correct by going sideways
- The public buys the most at the top and the least at the bottom
- Fear and greed are stronger than long-term resolve
- Markets are strongest when they are broad and weakest when they narrow to a handful of blue-chip names
- Bear markets have three stages — sharp down, reflexive rebound and a drawn-out fundamental downtrend
- When all the experts and forecasts agree — something else is going to happen
- Bull markets are more fun than bear markets
My job is managing risk to conserve principle and create absolute returns over time. What matters most to me is that I provide a disciplined management process for suitable investors, seeking long-term performance as measured by annualized and risk-adjusted returns and conservation of investment principle.
I do believe that my discipline will serve you well, and despite short-term uncertainties, risk management will prevail in the long-term.
Wishing you a happy and prosperous New Year.
Lance Roberts

Lance Roberts is a Chief Portfolio Strategist/Economist for Clarity Financial. He is also the host of “The Lance Roberts Show” and Chief Editor of the “Real Investment Advice” website and author of “Real Investment Daily” blog and Real Investment Report. Follow Lance on Facebook, Twitter and Linked-In

