
By Mark Hanson Finally, a full year after my 2013 family spring-training vacation, from which I returned waiving red flags about this market penning a note entitled “4-1-13 Hanson…The “Phoenix Phenomenon”…Spreading to a town near you”, analysts, reporters, and popular bloggers are noticing something isn’t right here.
- Leading indicating Phoenix demand destruction approaching generationally high levels of 2008
- Supply surge plus demand destruction can only be due to one thing…investor liquidations
- Volume precedes price up and down; 2013/14 demand destruction looks a lot like the 2006-08 demand destruction period
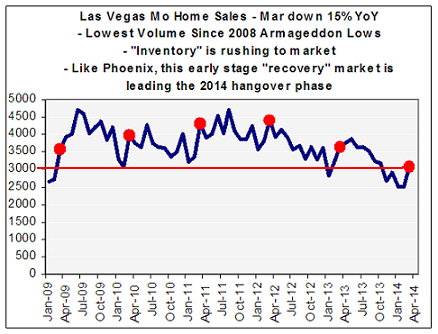
Since mid last year I havefocused on what I thought would be epic demand destruction in “all” of the leading indicating, new-era “investor” buy-to-rent, flip, flop and frolic havens. Phoenix and Vegas — two regions touted over the past couple of years to be prime examples of “escape velocity” and a “durable recovery” — have been two of my primary research markets.
Now, going into the peak season demand is down serious double-digit percentages YoY and barely higher than the 2008 Armageddon lows. And the pain continued in March based on data out this week from each region. This is exactly what happened beginning in 2006….first demand went, then prices went. Volume always precedes price in both directions.
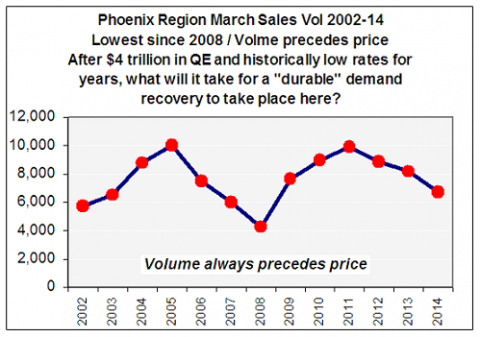
Item 1) Phoenix region March specific sales volume 2002 to 2014
- Sales at 6-year lows, down 17% yoy
- Supply up sharply, meaning demand destruction can’t be due to “lack of supply”
- New-era “investor” liquidation is obvious in the data
- Pendings down 35% YoY and bodes ill for the prime spring purchase season
- Next phase is lower prices
Demand remaining at 6-year lows in March — while supply continues to rise sharply — means that the demand destruction cannot be due to “lack of supply”. In fact, the data clearly points to new-era “investor” liquidation.
This stimulus-induced “demand hangover” is simply a repeat of what happened from 2003 to 2007 when stimulus (exotic loans that turned everybody into a millionaire on paper when qualifying for a mortgage loan) created a ton of incremental demand and pulled even more forward.
Then, when the stimulus suddenly ended (all the exotic loans went away over a short period of time) the market “reset to end-user fundamentals”; what the end-user can really afford using “fully documented 30-year fixed rate loans”.
The last few years of insatiable new-era, all-cash investor demand has influenced house prices much the same way as the exotic loan bubble did. That is, all cash investors controlling the market — buying without a “mortgage loan house price governor” — were able to run up prices way beyond what the average end-user could really afford.
The next phase for this market is lower house prices until end-user fundamentals and house prices reach a point of equilibrium.
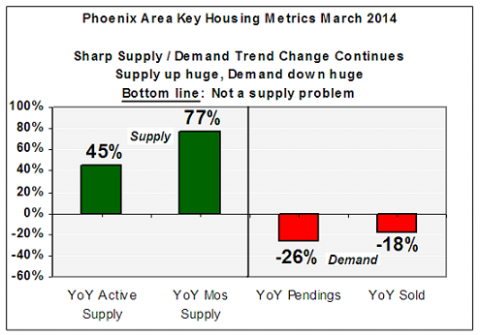
Item 2) Supply surging YoY while demand plunges. Clear investor liquidations. Pendings down twice that of sales bodes ill for prices and demand during prime spring selling season.
Bottom line: Typically when a homeowner sells a house they buy a new one unless they are an investor liquidating, or a owner-occupant moving out of town, in with their parents, or into a rental. As such, the easiest explanation for such divergent data in the chart below is investor liquidation.
Like I always say, “some how, some way, housing always gets what it needs and wants. And it needs mortgage rates down 100bps immediately”.

