
First, let’s get the headline number out of the way. The media reported last week that the inflation rate in April was +0.1% on a seasonally adjusted (SA) month to month basis. On a not seasonally adjusted, actual basis the change was +0.2%. The BLS said that the year to year change in top line CPI was a decline of -0.2%.
Is there really a basis for statistically manipulating the month to month change in the CPI between April and March because of seasonal differences? I looked at a not statistically manipulated long term chart of CPI, and didn’t seen any material evidence of a seasonal pattern in month to month changes with the exception of some years where there was a slight dip at year end. Seasonality the rest of the year was nil. There is no reason to use SA data in April. In the current case it resulted in suppression of the monthly increase by 50%.
“Core inflation” which excludes food and energy because they usually are “volatile,” which means usually rising faster than everything else, was reported to have risen by 0.3% on an SA basis. Both the core and total CPI are based on how the BLS defines consumer prices.
The BLS (which some bloggers derisively refer to as the Bureau of Liar Statistics) defines CPI as a basket of narrowly construed consumption goods which it adjusts hedonically. You know how hedonics works. When the price of steak goes up, they substitute hamburger. Hey! Meat is meat!
The CPI includes only goods that are consumed. It does NOT include your house, because your house isn’t consumed. It’s an “investment.” They didn’t say it was a good investment, just an investment, so they don’t count the price of houses in the CPI. They used to, but it got too expensive, so in 1982 they eliminated house prices and made up a substitute measure called “Owners’ Equivalent Rent.”
They did that because government benefits, salaries, and contracts are usually automatically adjusted by CPI. That’s the real purpose of CPI– to index the cost of government benefits and contracts. When housing inflation got too hot in the 1970s the government decided it had to find a way to get housing out of the CPI. They did it by classifying your house as an investment good, not a consumption good. That took care of that problem, and it has saved the government and taxpayers hundreds of billions in costs over the past 23 years. It has also cost social security beneficiaries and government workers as much–big government contractors, not so much. They wrote big escalators and contingencies into their government contracts, so that suppressed CPI escalators don’t hold back their skimming operations.
Since the government defined housing out of CPI, it has enabled economists to ignore housing inflation as a component of inflation. In fact, anything that isn’t a consumable doesn’t count toward inflation. Housing inflation doesn’t count. Land inflation doesn’t count. And the inflation of financial assets like stocks and bonds doesn’t count. The only inflation that counts is the inflation of stuff that people consume. It has become a convenient excuse for ignoring all of the fallout and dangers of the most insidious kind of inflation–asset inflation. Since asset inflation makes the plutocrats richer, their handmaidens in the economics field and the Wall Street captured media see nothing wrong with it.
But never mind the fact that financial assets are inflating by 10% or 15% or 20% per year. That’s a digression. We’re here to figure out about how much of the kind of “inflation” that the establishment focuses on, has been suppressed.
First, the top line CPI includes energy prices. The energy component is about 9% of total CPI. It was down in April, so it reduced top line CPI. But gasoline prices, which the Department of Energy reports on a weekly basis, were UP 4% month to month in April. How did the BLS turn that into a decline in energy prices? To paraphrase Winston Churchill, that’s “a riddle, wrapped in a mystery, inside an enema”– or something like that.
The BLS showed Energy being down 0.5% month to month, when gas prices rose 4%. At 9% of the index, that’s a swing of 9% x 4.5% or 0.4%. That would have made the change for the month +0.5%. If you add back the seasonal suppression manipulation factor, the number becomes 0.6%. Remember, this is a month to month change. I won’t insult your intelligence by annualizing it. We’ll get to the annual analysis in a moment.
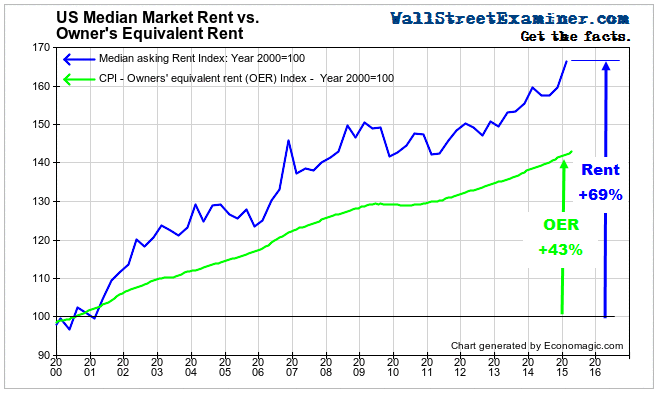
Housing, or more precisely the shelter component of housing, is the largest component of CPI. As the BLS sees it, shelter is just the cost of the roof over your head. The BLS calls that cost Rent of Shelter and includes that as 31.7% of total CPI. This is the largest component of the index. Once again, this has nothing to do with the actual prices of houses, regardless of the fact that they may be rising at 5-10% per year.
To the BLS, the government, to mainstream economists and the mainstream financial media, the actual price of housing is not relevant to inflation. For the shelter component of the CPI the BLS relies on a survey of renters to account for 7% of CPI or about 20% of the shelter component, and the another 24% of total CPI or about 80% of the housing component is based on this made up thing called “Owners’ Equivalent Rent” (OER). The other fraction of a percent is composed of a few minor throw-ins like hotel rooms and dorms. The main thing is the 31% based on the BLS’s concept of “rent.”
Here again, the BLS does not care about the actual level of market rents. Rents may be rising at 5-10% in the market, but your lease probably has CPI escalators at most, or your landlord might only add a few dollars per month when your lease renews to avoid forcing you out and experiencing vacancy or the cost of re-renting the unit. The BLS only asks how much you are paying in rent. If you’ve been in your apartment for a few years, your rent is almost always a good bit less than what the apartment would rent for if you vacated and the apartment went on the market.
By the same token, the BLS asks owners what they think their house would rent for. How are owners supposed to know that? Do you know what your house would rent for on the open market? Almost certainly not. So the BLS imputes OER based on the surveys of renters at their suppressed contract rents tied to, or less than CPI. Then they estimate OER increases on the same basis. The whole process is like a dog chasing its tail. 31% of CPI is based on this nonsense circular logic.
In April, the BLS said that both renters rent and OER rose by 0.2%. There it is–the self fulfilling prophecy of rent increases tied to CPI.
I did a little digging and found national median rents from two sources–Zillow and the apartment listing service Apartmentlist.com. These two companies have large databases of rental listings throughout the US. Apartmentlist.com showed 1 bedroom apartment rents up 0.6% in April and 2 bedroom apartments up 0.5%.
Zillow’s rent listings cover single family homes and condos for rent. They were up 1.4% in April. Their numbers are volatile so I’ll disregard that 1.4%. Oh, wait, what’s this? Since January they’re risen by 6.7%? That sure looks like a trend. We’ll still disregard the 1.4%. Because the rent is too damn high. That kind of rent increase isn’t sustainable.
Zillow also creates a rental price index using smoothing methodology. If you have been reading me for a while, you know how I feel about smoothed housing data. It’s caca. It results in a severely lagged number that does not reflect current market conditions. It would be similar to reporting the S&P 500 only on the basis of its 90 day moving average level. We just don’t do that because we know it would be absurd.
Regardless of that deficiency, we have little else to go on for April, year to year. The annual increase in Zillow’s rental price index is 4.2% for April. This covers a period when the total CPI was down a couple of tenths, and the OER component of CPI was up by 2.8%. It appears that OER shaved 1.4% off the real rate of rent increase based on Zillow’s smoothed data for the past year. Given the surge in rents since January, it’s probably more than that, but there’s no need to try to be more extreme than the smoothed number. It’s bad enough.
On a monthly basis, I’m satisfied with using Apartmentlist’s numbers showing a blended increase of 0.55% between 1 and 2 bedroom apartments. Considering that Zillow’s data indicates that house rents went up a lot more than that, let’s round up to 0.6%. Using the rounded weighting of 30% of CPI for housing and the difference between an actual increase of 0.6% versus the 0.2% in the BLS’s number, the impact on CPI is 30% x 0.4% = 0.1%.
Adding that to the rest of the “reality adjustments”–for seasonal suppression, for the mystery energy cost suppression factor +0.4% this month, and for the housing inflation suppression factor–the CPI would have been up by 0.8% in April had not the BLS engaged in all this suppression. That saves the government, and we the taxpayers, billions.
Are you happy about that? I didn’t think so.
But does the BLS CPI number measure “inflation?”
No.
Had “inflation” been correctly counted it would have been up 0.8% for the month. That’s a huge number and it won’t stay that high every month. But the point is that the CPI as reported does not measure inflation, even the narrowly defined version of inflation that mainstream economists use.
Not only did the month to month change in CPI misrepresent inflation, the year over year change of a decline of 0.2% was also off.
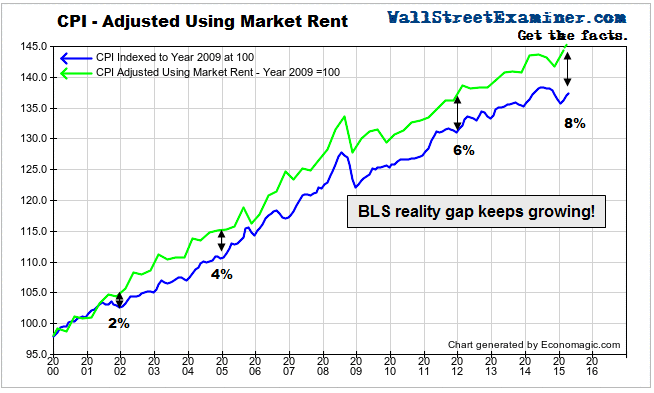
The reality adjusted index is based on quarterly data. For the first quarter, the index was up 0.55% on a year to year basis. Taking into account the changes in April, the likely year to year change is now around 1%. It’s still below the Fed’s target, but at the rate things have been heating up in the past few months, not for long.
The reality adjusted year to year inflation rate was running 3-4% per year before the collapse in energy prices in the second half of 2014. With that situation now stabilized, if not bouncing back, and rent increases running strong, it’s entirely plausible that the reality adjusted CPI will be above 2% later this year. The Fed won’t know it because it focuses on the PCE deflator, which includes even more suppression devices than CPI does.
So is the Fed behind the curve?
Uh… yeah.
Here’s a video I did on this subject in June of 2014. Nothing has changed.

