
By Tyler Durden at ZeroHedge
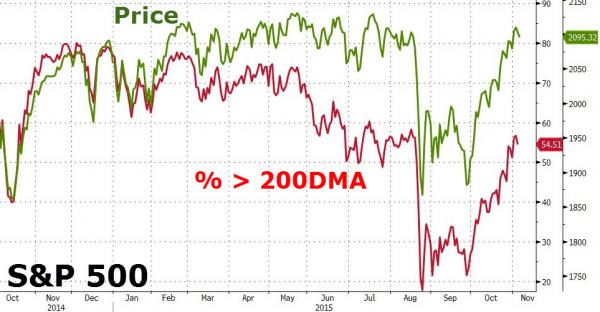
With the S&P 500 just over 1% from its all-time record-high, it is perhaps shocking that only just over 50% of the index members are trading above their 200-day moving average. Worse still, the divergence between index price performance and underlying component performance has never been greater as The Fed’s last money-printing effort drove a wedge between the have-nots and the have-yachts…
The S&P 500 (with its 108x P/E Facebook and 928x P/E Amazon) is practically back to record highs but underlying breadth remains a disaster…
But, when we look at the entire US equity market – based on the world’s largest stock index NYSE Composite – this is a story that began when The Fed unleashed the $85bn per month QE3…
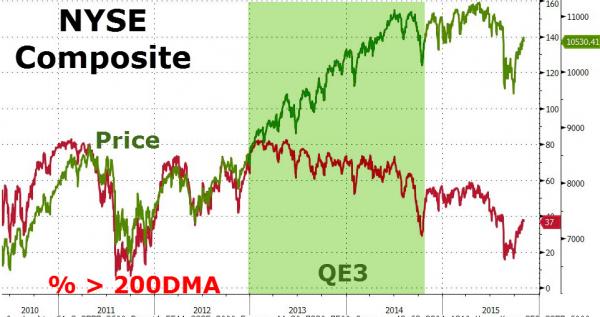
As is clear, the massive surge in performance of the overall indices was concentrated more and more among the names underlying the index as the free money party from The Fed only benefitted the biggest.
And that’s where it all went wrong for The Fed as their plan to re-wealth the world failed to trickle down yet again.
Source: Breadth Breaking Bad – Where It All Went Wrong For The Fed – ZeroHedge

