
If any proof is needed of the baleful impact on Middle Class America of the Fed’s abject subservience to Wall Street, the chart below tells you all you need to know. According to REDFIN, the monthly mortgage payment in April on the median priced home is up 11.3% from last year and a staggering 70% just since April 2021.
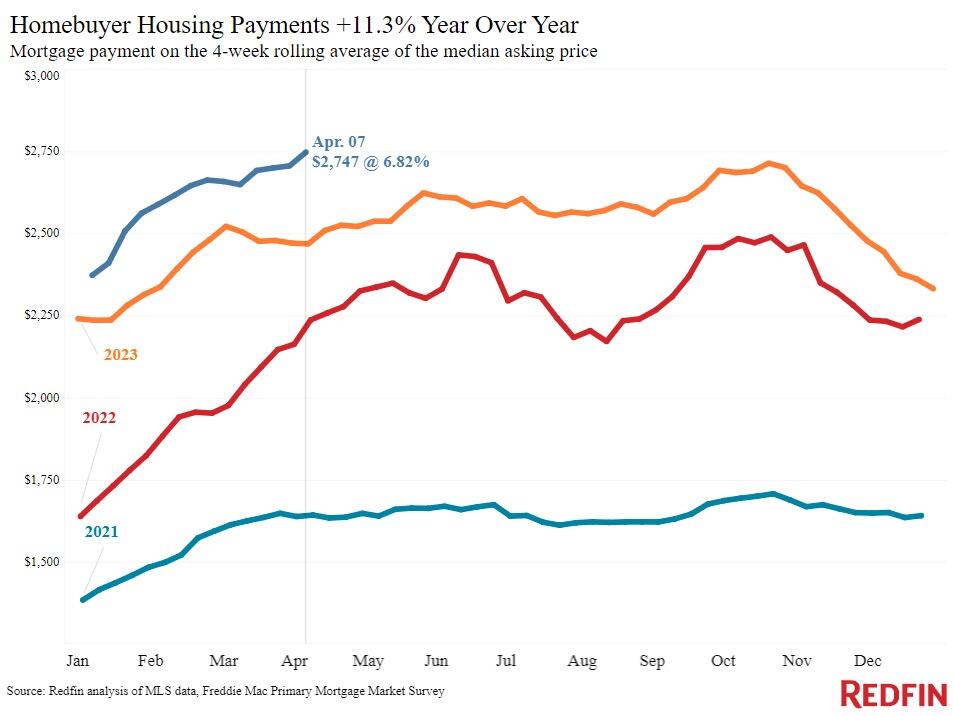 But, no, it’s not because the geniuses in the Eccles Building have allowed longer-term interest rates to partially normalize. To the contrary, the real culprit is soaring home prices, which have been fostered by the Fed’s relentless suppression of interest rates and saturation of the homeownership market with cheap mortgage debt.
For want of doubt, here is the 30-year mortgage rate for the last forty years. Neither today’s nominal rate (black bars) at about 7.0% or, more importantly, the inflation-adjusted rate (red bars) at 3.0% can be considered even remotely high relative to the long-term trend.
In fact, today’s inflation-adjusted rates only seem high relative to the total aberration of 2021-2022 when the Fed drove real interest rates deeply into negative territory. Of course, no one who thinks rates are now too high has explained how banks and other investors in mortgage debt would be pleased to lose principal year-in-and-year out if the pandemic era monetary madness were to be made permanent.
More appropriately, the real message of this graph is that during well more than 75% of the time over the last four decades real mortgage rates were higher than they are today. Yet that did not send the housing market into turmoil or push potential homebuyers out into the snow.
Nominal and Inflation-Adjusted 30-Year Mortgage Rates, 1984 to 2023
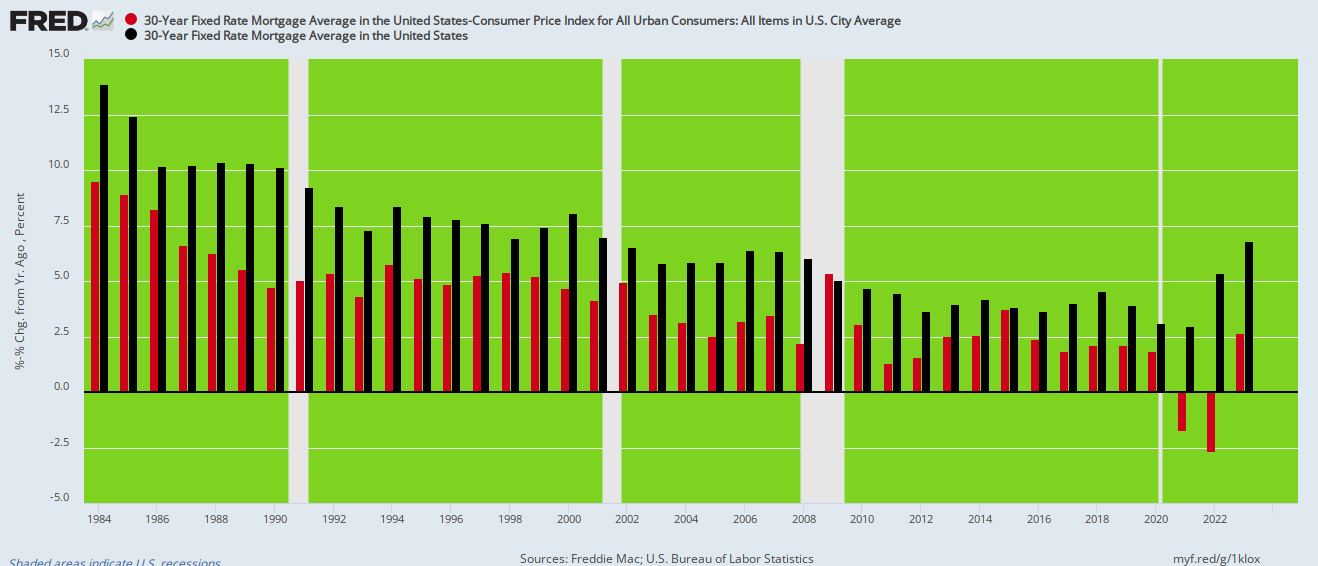
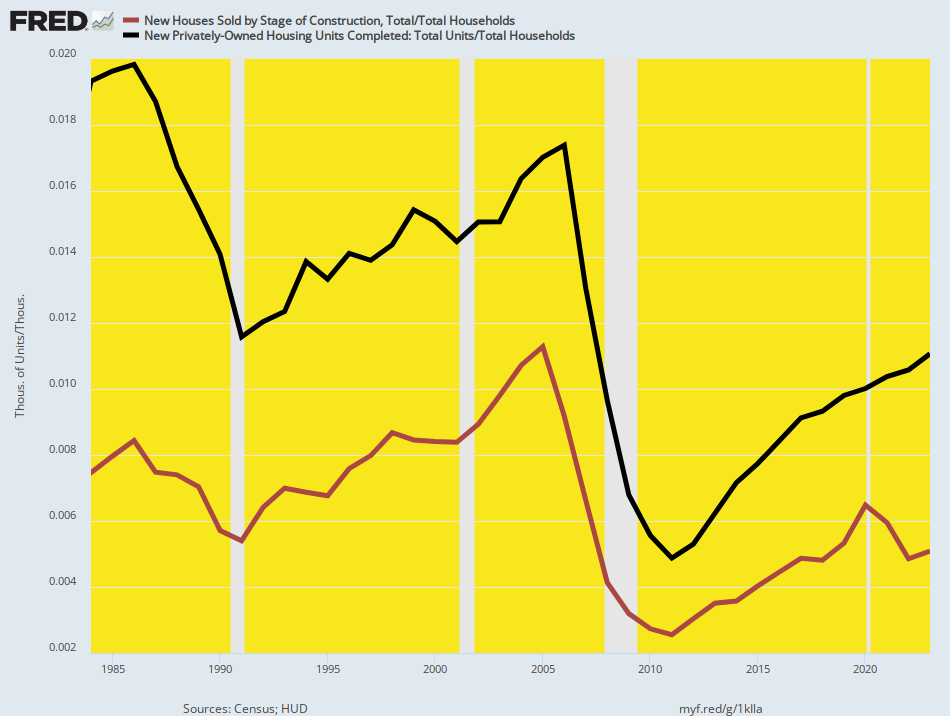
In fact, between 1984 and 2007, the inflation-adjusted mortgage rate averaged +5.25% or 1.5X more than current levels. Yet back then both family housing sales and new units completed relative to the number of households needing shelter posted at levels far higher than during the last 12 months.
Cheap real rates consequently had a far greater impact on housing prices and speculative activity in the sector than on actual levels of housing activity. In fact, the number of new completions per US household (black line) was 75% higher in 1984 than it was in 2023, while the level of homes sales per US household (red line) was 47% higher in 1984. But to remind, real mortgage rates in 1984 had posted at +9.5 versus and average of +2.7% in 2023.
New Home Sales And New Housing Unit Completion Per US Household, 1984 to 2023
What the Fed did stimulate in the housing sector, of course, was prices. The median home sales price (dashed blue line) of $79,900 in 1984 had risen to $425,000 by 2023, representing a whopping gain of 430%.

