It is often very easy to fixate on the S&P 500 as if it were the only current proxy of the broad universe of stocks. Like the Dow Jones Industrial Average before it, the 500 has attained synonymy with stocks as it is the most widely publicized and recognized value. But just like the DJIA, the index has its own shortcomings, especially where there is a danger of it being somewhat misleading by virtue of its narrow construction. The DJIA has been relegated to a second tier simply because what was an industrial world is no longer dominated by such firms and their share prices.
While the S&P 500 has no such drawback, including a representative sample of all industries in the economy, it is narrow in the sense of capitalization. In terms of being a representation of not just all stocks but stock prices as an economic barometer, the index is thus susceptible to any “exogenous” factors that differentiate economic and share price performance among business size (in general).
This “recovery” period has been marked by just such a divide where small and medium businesses have not experienced the same strength of a rebound, or even the rebound itself, as the larger firms. That reality has been more of dichotomy between non-corporate and corporate businesses, but I think in 2014 the overall size distinction regardless of legal format became paramount.
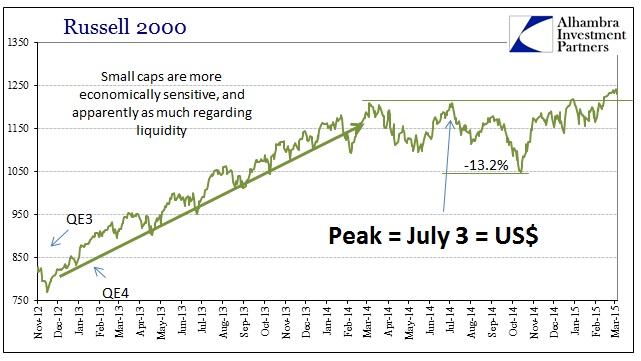
First and foremost, broader stock price measures have not kept pace with the S&P 500. Furthermore, the NYSE Composite, for an example of a very broad proxy for share performance, has been flat ever since July 3 whereas the 500 has attained record after record. The change in trajectory for the NYSE is stark in this contrast:
While the S&P 500 clearly outperformed the NYSE Comp up to July 2014, there was no mistaking the parallel trend of at least much the same degree. Of course, peaking and flattening on July 3 puts this squarely within the realm of the “dollar”, and thus opening the same interpretations of liquidity and economy that have shaped credit functioning (including October 15, which even the 500 could not ignore) and commodities.
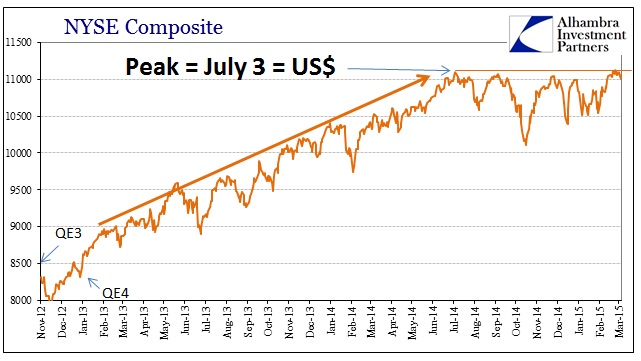
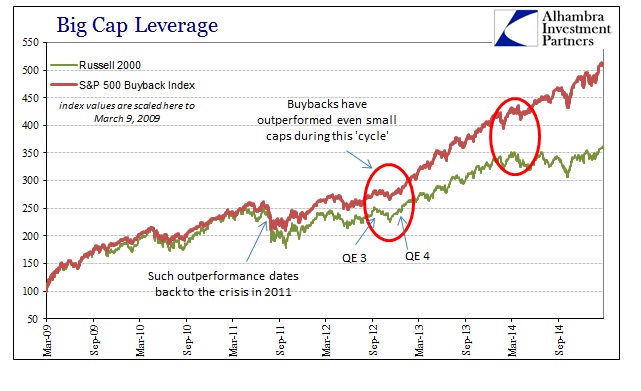
This is a feature very similar to another broad stock index, the Russell 2000, which has fared better than the NYSE of late but still accords that totally separate trajectory.
Since the Russell is almost purely a small cap index, it is very interesting to note that the current mostly flat trend actually predates the NYSE and the “dollar”; going back to February 2014 and the Polar Vortex. In reality, the Russell’s struggles have more to do with the drastic and sustained decline in earnings growth that became very apparent at that time regardless of snowfall. Small cap stocks have always been more susceptible to macro changes and thus the redrawing of the Russell’s trend without much of a breakout (perhaps not yet) more than suggests unsolved economic concerns.
In sequence then, by contrast to the 500, the peak of the Russell 2000 followed by the NYSE Composite (and the “dollar”) would tend to suggest a marriage (with a lag) between economic concerns and liquidity. That leaves the larger caps as if they have a liquidity capacity mostly (not quite fully, as October 15 showed that even large caps cannot always defy sustained financial disorder) apart from the rest. Of course, that produces no mystery as the most prevalent feature of stock buying is of companies themselves of themselves, which is unsurprisingly concentrated among the largest firms.
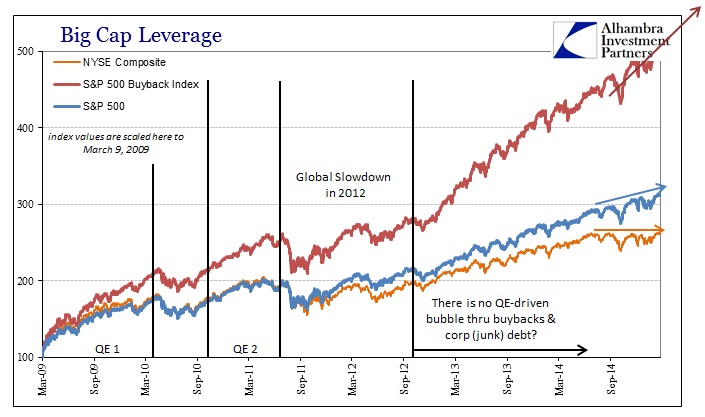
The absolutely huge disparity between the performance of S&P’s Buyback Index and the rest is about all you need to understand about what the S&P 500 is telling us about anything. It says nothing more than big companies are easily able to access debt and use internal resources (without shareholder disdain) for nothing but financialism run amok – clearly detached from any viewpoint of actual economic performance by intended monetary policy disruption.
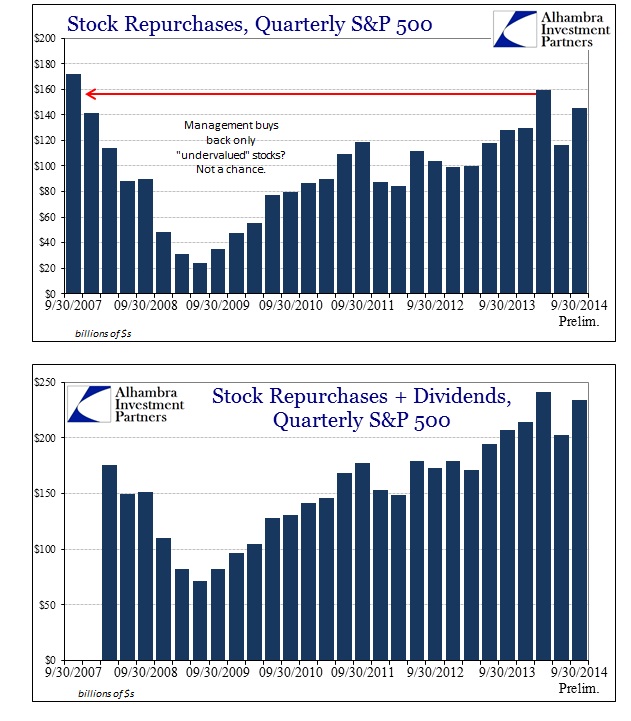
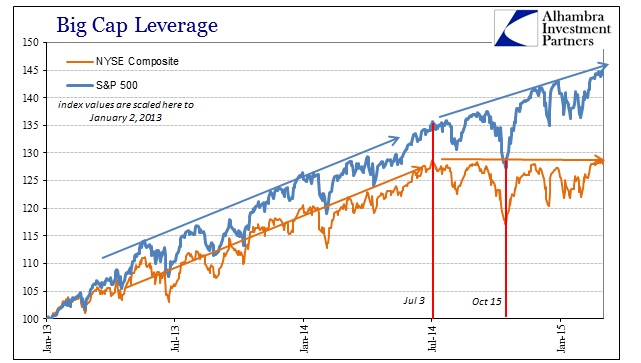
We know that because corporate CFO’s are not buying back shares due to economic fundamentals or even their own. Indeed, there has been very little relation of late to even cash flow growth and the increase in buyback activity; instead buyback proportions have almost reached an inverse relationship with earnings. The lower earnings growth gets, especially projected earnings, the more shares a company will tend to repurchase. That relationship seems to have reached absurd proportions with this year’s economic reality, whereby earnings and even revenues are projected to decline for FY2015 yet buybacks announced so far are the most on record.
In terms of economic projection, then, the large cap index is thus even perhaps inversely relating share prices with economic growth – the worse it gets in the economy, the better the shares perform. That is perhaps overstating the case by more than a little, for effect, but you get the point. By and large, the S&P 500 by proxy is being driven by the tendency of corporate CFO’s to “return” cash to shareholders and less and less by whether such cash is being derived through organic and, more importantly, sustainable cash and earnings.
The track record of CFO’s in that regard only reinforces this negative factor in wider share prices. Again, the cliché spun by market bulls is that companies are only recognizing “undervalued” shares through their activity. Yet, they sat fully on the sidelines in 2009 when share prices were not just undervalued but seriously so by any comparison or standard. Instead, they were very busy buying far more than half a trillion dollars in shares in 2007 right at that top. And they are repeating the pattern once more – the higher share prices go, the more they buy regardless of any fundamental basis.
If there is another bubble, the third in close succession, there will be no doubt its pathology upon collapse. Even so, it is still vitally important to understand exactly what share prices are measuring, and there is no reasonable expectation as to harmony in that respect among various indices. That is the reality of an age where central banks are openly repressive and distortive to a degree never before thought possible (and certainly not for seven and a half years). It’s not just that stock prices stand alone supporting Janet Yellen’s view of the economy, squarely against credit, commodities and most especially liquidity of the “dollar”, it is actually worse than that as only a narrow segment of stocks are doing so, and by her own (and her prececessor’s) handiwork.