
My weekly updates on Initial Unemployment Claims have been a broken record for many months. This week is nothing new. It was another record low. The headline, fictional, seasonally adjusted (SA) number of initial unemployment claims for last week came in at 270,000. The Wall Street economist crowd consensus guess was almost right on the mark this week, at 271,000.
We focus on the trend of the actual data Instead of the seasonally manipulated headline number expectations game. Facts tend to be more useful than the economic establishment’s favored fictitious numbers. Actual claims based on state by state filings were 225,090, which is another record low for this calendar week. It continues a nearly uninterrupted string of record lows that began in September 2013. But there’s a conundrum inherent in these numbers, because withholding tax collections have collapsed in recent weeks. How can that be, and what does it portend?
The Department of Labor (DoL) reports the unmanipulated numbers that state unemployment offices actually count and report each week. This week it said, “The advance number of actual initial claims under state programs, unadjusted, totaled 225,090 in the week ending August 1, a decrease of 5,133 (or -2.2 percent) from the previous week. The seasonal factors had expected a decrease of 7,745 (or -3.4 percent) from the previous week. There were 247,877 initial claims in the comparable week in 2014. ”

Click here to view chart if viewing in email
You can see for yourself from the chart just how extraordinarily low these numbers are.
When using actual data we want to see if there’s any evidence of trend change. Thus we look at how the current week compares with this week in prior years, and whether there’s any sign of change. The actual change for the current week was a decrease of -5,000 (rounded). The July-August turn is a mixed week, sometimes down, sometimes up. Based on the data for this week from the last 10 years, the current decline middling, a little weaker than last year (-10,000), but better than an increase of 7,000 in 2013.
Week to week changes are noisy. The trend is what is important and it remains on track. Actual claims were 9.1% lower than the same week a year ago. Since 2010 the annual change rate has mostly fluctuated between -5% and -15%. This week’s data was near mid range. There’s no sign yet of a significant uptick in the trend of firings and layoffs.
Population has been growing and the size of the workforce has as well, although not as fast as population. To get a better idea of how the claims data is performing over time, I normalize it based on the size of monthly nonfarm payrolls. Here’s where we can see just how extraordinary the current levels are. There were 1,576 claims per million of nonfarm payroll employees in the current week. This was a record low for that week of July-August, well below the 2007 previous record of 1,986.
The 2007 extreme occurred just before the carnage of mass layoffs that was to begin a couple of months later. Employers were still clueless that the end of the housing bubble would have devastating effects. If they were clueless then, they are in an advanced state of delirium and delusion now.
However, it is absolutely normal for employers to completely miss the signs of impending doom as I recounted in last week’s update. I would merely repeat here that history shows that the fact that claims are at record lows is warning enough that the financial engineering bubble is about to burst.

Click here to view chart if viewing in email
I look at an analysis of individual state claims as a kind of advance decline line for confirmation of the trend in the total numbers. The impact of the oil price collapse started to show up in state claims data in the November-January period. While most states show the level of initial claims well below the levels of a year ago, in the oil producing states of Texas, North Dakota, Louisiana, and Oklahoma, since the beginning of 2015 claims have been consistently above year ago levels. North Dakota and Louisiana claims first increased above the year ago level in November of last year. Texas reversed in late January. Oklahoma joined the wake shortly after that.
Data for the August 1 week:
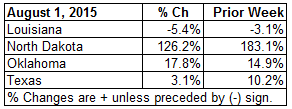
Click here to view table if viewing in email
Claims increased year to year in North Dakota, Oklahoma, and Texas. The drop in Louisiana this week was the second straight. That state had consistently shown higher year to year claims prior to the past 2 weeks. The numbers have varied widely week to week but the trend of claims being significantly higher than the same week last year has been persistent. Texas, with a huge and more diversified economy improved in the second quarter as the price of oil rebounded and stabilized, but that improvement was temporary and new claims in Texas have been climbing in July. This was Texas’s worst showing since the week of April 18.
In the August 1 week, 12 states had more claims than in the same week in 2014. That was up from 10, last week. This number fluctuates widely week to week with many states near even. At the end of the third quarter of 2014 just 5 states showed an increase in claims year to year. At the end of 2014 that had increased to 8. In early April this year the number had risen to 22. The July 25 number was the lowest it has been all year.
The 22 states that were higher in early April gives us a benchmark to watch, similar to an advance decline line in the stock market. If the number of states showing a year to year increase in claims should exceed 22, it should be an indication that the national trend of decreasing claims has reversed.
I track the daily real time Federal Withholding Tax data in the Wall Street Examiner Pro- Federal Cash Flows report. The year to year growth rate in withholding taxes in real time is now running +1.9% in nominal terms. That continues the downswing that took place in July and in real terms is now near zero or lower, depending on what the reality is on wage and salary inflation.
The nominal growth rate has dropped sharply over the past 5 weeks after being remarkably consistent around +5-6% in the second quarter. That nominal growth rate had been good for GDP prints of around 2-2.5% annual growth. If it continues, the latest growth rate in withholding would suggest a negative GDP print for the third quarter.
That decline in withholding was already apparent in the week of the nonfarm payrolls survey, which is the week including the 12th calendar day of the month. The data indicated at that time that if the seasonal adjustment wasn’t too far off the jobs number should be significantly lower than the consensus guess. We already saw that with the ADP private payrolls data, which gave economists a chance to adjust their guesses. The consensus guess of 229,000 still looks too high relative to what the tax collections show.
The record lows in claims are inconsistent with the sharp drop in withholding tax collections. It suggests that regular weekly incentive pay, such as sales commissions at some retailers, auto dealers, and the like, has collapsed over the past month. If that is the case, then it won’t be long until the layoffs begin.
The post Withholding Tax Collections Have Collapsed But Unemployment Claims Are Still At Record Lows appeared first on The Wall Street Examiner. Follow the money! See and understand the liquidity flowing from the Fed, Treasury, and other major central banks and primary dealers as they impact markets in the Wall Street Examiner Professional Edition.

