
The Case Shiller Index for September 2016 was reported today, telling us what we already knew from 5 months ago. In fact, we knew it and reported it not 5 months ago, but 18 months ago, when it actually happened. Median existing home sale prices broke the housing bubble peaks of 2005 through 2007 in June of 2015.
Case Shiller is just “a little bit late”. That’s nothing new. The indexes are designed to be late, and they’re designed in a way that suppresses the reality of the marketplace as the housing market becomes increasingly bubbly, frothy and dangerous.
It’s why Nobel Prize winner Professor Robert Shiller hasn’t gotten this market right since his warnings first issued on CNBC in 2005. He never did call a top or forecast a crash, but we’ll give him credit for sounding a warning that prices were going up too fast.
Case Shiller’s composites, which are calculated by Dow Jones/S&P do better at market lows. Professor Shiller was only about a year and a half late in recognizing the housing buy of the decade in 2011. Lately he’s been talking about another housing bubble. But it took until the current release of the Case Shiller national index index to show that prices had reached the levels of the 2006-07 peak.
Now the mainstream media are reporting that the Case Shiller “National Index” has reached a new high. The National Index uses a different methodology than the more well known and widely followed 20 City Composite. In fact, prior to 2014, the national index was only reported quarterly. The national index uses the decennial data from the US census then imputes values for months between the 10 year census intervals using the FHFA data. That data is published monthly by the Federal Housing Finance Agency.
The Case Shiller 20 City Composite uses paired sales data recorded by each county after the sale has settled and the property has changed hands. Paired sales means only sales of properties that have sold before. This method eliminates now houses or houses that have been recently renovated to current market standards.
As a result, the Case Shiller Indexes are essentially the This Old House indexes. As houses age and show more and more physical deterioration and stylistic (aka functional) depreciation, the current sale of an older home represents prices of properties that are inferior to current market standards. Not many home owners do recent renovations to keep their houses up to current standards.
At the time the first sale of the pairing occurred, the properties are likely to have been current for that time. The paired sale method fundamentally suppresses the current index level by overweighting old, rundown pieces of you-know-what in the indexes. As a result the indexes understate the true amount of inflation occurring in the current market.
Once the sales have closed and hit county public records, then it takes nearly two months to aggregate and report the data. That means the CS indexes reflect sales that actually took place approximately 5 months earlier when the contracts were signed between buyers and sellers. Case Shiller then lags the data even more by reporting not the actual index level for the most recent month, but a 3 month moving average. It would be as if a stock investor wasn’t interested in the current price level but focused solely on a 90 day moving average. The currently reported data is actually very old data by the time it’s released.
Prior to 2014, the 20 City Composite was the most widely followed and reported Case Shiller Index. Today, it barely gets any mention. Perhaps the people at Dow Jones/S&P realized just what a terrible job the old 20 City Composite was doing in accurately reflecting the market. So they borrowed numbers from the decennial census data and the monthly FHFA sales data, and created a bastardized measure that manages to only lag the market by 18 months. In fact, while the national index has eked out a new high, the 20 City Composite is still below the 2006 peak level. It is utterly useless.

By substituting 10 year census data and FHFA data, S&P was able to lower the level of the 2006 peak but the result was that the National Index actually understates the housing inflation that has happened since 2012 even more than the 20 City Index. The FHFA data applied in the national index since 2010 uses a calculation method that is almost identical to that used in the Case Shiller 20 City Composite. So what’s the point of using the National Index? To show that prices are catching up to the old high faster than using the old method.
But, truth is, even the National Index grossly underrepresents the bubbly, frothy nature of the current market. The NAR reports an unadjusted, unmanipulated national median price that reflects the whole market, both older houses and new ones that have been listed and sold through all the national Multiple Listing Services. It reports actual sales usually that actually went under contract in the preceding month. Current data reflects October contracts, not contracts July contracts reflected in Case Shiller’s current data.
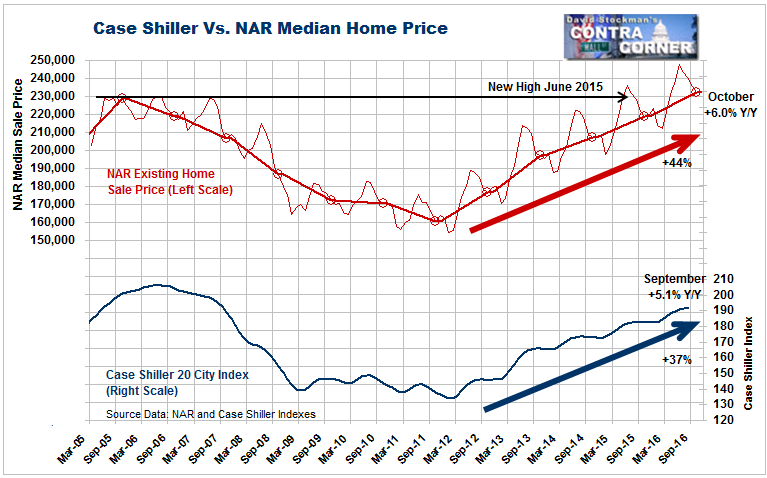
The NAR’s data tells a far different story that Case Shiller. Case Shiller shows total housing inflation of 43% since the bottom of the housing crash. That’s a compound inflation rate of 3.8%.
But the NAR’s data shows a much frothier market. Its index cleared the 2006 high in June 2015. That was reported in July 2015, 16 months ago. From the cycle low in 2011 the Case Shiller 20 City Composite inflated by 37%. The NAR’s broad, unadjusted market index showed a 44% increase. That’s an average compound inflation rate of 7.6%. The NAR showed a year to year gain of 6.0% in October. Case Shiller shows 5.1% for September.
In spite of current price levels being 6% above the 2006 bubble high, the mainstream media says that prices are back to “normal.” I suppose that they think that prices above the top of the bubble are “normal.” I’d call them dangerous. If mortgage rates continue to head up, even more dangerous. The banking system could ill afford another housing price “adjustment” destroys homeowners’ equity and leads to another wave of foreclosures.
Lee Adler first reported in 2002 that Fed actions were driving US stock prices. He has tracked and reported on that relationship for his subscribers ever since. Try Lee’s groundbreaking reports on the Fed and the Monetary forces that drive market trends for 3 months risk free, with a full money back guarantee. Be in the know. Subscribe now, risk free!

