
The Commerce Department reported this week that total construction spending fell in September by 0.4% on a seasonally adjusted annualized basis. Economists had guessed that the figure would rise by 0.5%. This was the largest decline in the seasonally finagled headline number in 9 months.
The report said that total spending was down 0.2% year over year. The government routinely reports the annual rate of change incorrectly, using seasonally adjusted data, and the ever diligent mainstream media dutifully reports the erroneous number. Year over year comparisons should be done using the actual not seasonally adjusted monthly data because comparing the same month in each year requires no seasonal adjustment. It’s the same season. Using seasonally adjusted data introduces not one, but two seasonal adjustment errors, doubling the likelihood and the degree of error.
The actual, unmanipulated data showed a year to year decline of -0.6%, triple the size of the reported number. The difference between -0.2% and -0.6% is obviously insignificant in the big picture, but what happens if the 200% difference is on a seasonally adjusted year to year decline of 1% or 2%?
Looking at the month to month change in the actual numbers, September was down 1.6% from August. A September decline is normal, so the question is how this September compares with past Septembers. It was worse than 2015, when September was unchanged from August. The average decline for September was -1%. Any way you slice it, September wasn’t good.
This data is reported in nominal terms. The government does not report the numbers on a real basis, that is, adjusted for inflation. We can approach the real number by dividing the nominal monthly data by a price index such as the CPI or Producer Price Index (PPI). Construction isn’t a consumer good, so the CPI doesn’t apply. PPI comes closer, but it’s still too broad for construction cost inflation.
The BLS reports numerous series for PPI on various types of construction. Many of these series are new and only go back to 2009 or even more recently. I wanted to compare current data with at least the peak of the last cycle. One PPI series going back to 2006 is for office building construction. In my 15 years as a commercial property appraiser and market analyst, I saw little difference in the rate of cost changes in various types of construction. The inflation rate on office building construction should fairly represent most types of construction, much of which is commercial.Total construction spending includes both private and public construction. Public construction, which is construction by governments and government agencies, can be countercyclical. Public projects tend to increase when the economy is bad, and decrease when the economy is good. So I also want to look at private construction on its own. That will come below. First we’ll consider the total data.
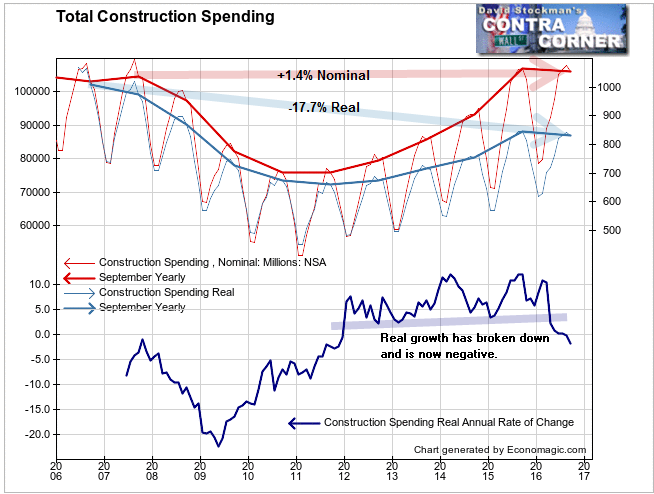
Total spending was down 0.6% year to year in nominal terms. It took until 2015, a total of 8 years to get back to the total nominal spending level reached at the last peak in 2007. The current level of spending is just 1.4% above the peak level of 2007.
But we have had lots of inflation since then. That number includes the inflation. In real terms, adjusted to remove the inflation component, the total amount of new construction was down by 1.8% versus a year ago. More importantly, real construction spending is now down 17.7% from the 2007 peak! That’s after 7 years of zero interest rates. The Fed has suppressed the cost of construction financing to its lowest level in history, and total construction spending remains down nearly 18%.
The real annual growth rate had fluctuated by stayed positive since 2012. This year the momentum of growth began to slow early in the year. Then it broke down below the slowest growth rates of the past 3 years. This technical breakdown from slowing growth turned into outright contraction in September. The breakdown has been rapid.
Most of the decline has been due to weakness in public construction, both over the long haul and especially this year. Where are all those infrastructure projects that were supposed to boost the economy? Governments have been cutting them, not increasing them. America’s infrastructure continues to crumble.
The decline in public construction has been most responsible for the weakness in the top line numbers, but private commercial construction (excludes residential) hasn’t been such great shakes either. It hasn’t gone negative yet this year, but the year to year growth rate has slowed to +2.9%. A year ago it was +11.2%.
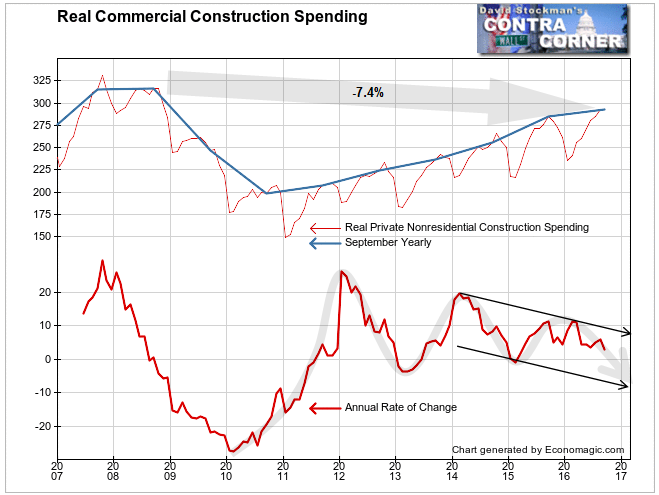
The data was also bad month to month, posting a 0.1% decline. Over the past 10 years, real private commercial construction in September has averaged a 2.2% increase. In September of 2015, the gain was 3.1%. Last month’s drop of -0.1% was the worst September performance since 2010.
Over the longer term, private commercial construction has fallen. It is down in real terms by 7.4% since the peak of September 2008, just prior to the market collapse.
Don’t expect this data to lead the economy or the market. For example, existing home sales volume peaked in 2005 and began to plummet in 2006. The stock market topped in 2007. Meanwhile private commercial construction continued going gangbusters until 2008. There was a similar lag at the bottom of the recession. Stocks bottomed in March 2009. Commercial construction didn’t begin to rebound until 2011.
The fact that this data hasn’t gone negative yet is no reason to be sanguine about the outlook. Commercial development projects usually take a year or two to plan and to get government approvals before a shovel goes in the ground. By the time construction starts, the economy may already gone over the hill.
The fact that growth momentum is slowing should be warning enough. The last cycle peaked on a massive bubble blowoff in 2007. Upward momentum began falling in 2007 before going negative in the second half of 2008. In the current environment, the growth rate has been cycling lower since 2012. Commercial space demand has been soft.
Private commercial construction growth looks set to turn to contraction late this year or early next year. By then, both the stock market and the economy should already be well over the hump, headed into recession. Interest rates are already virtually at zero and QE driven stock market gains have already proven not to trickle down to stimulate the economy. Monetary policy won’t be able to save us this time.
Lee Adler first reported in 2002 that Fed actions were driving US stock prices. He has tracked and reported on that relationship for his subscribers ever since. Try Lee’s groundbreaking reports on the Fed and the forces that drive Macro Liquidity for 3 months risk free, with a full money back guarantee.

