
In our last look at taxes we saw the Federal excise taxes don’t support the idea of a growing economy. One of the largest components of Excise Taxes is the Highway Trust Fund tax on gasoline. That data is only provided in the Monthly Treasury Statement which comes out on the 8th business day of the following month. The report for May is due on June 12. We currently have April data. In addition to that data, the US Energy Information Administration (EIA) reports gasoline sales volume on a weekly basis. That info is available through last week.
Like all excise taxes the gas tax is based on unit sales, not dollar value. So it measures the actual volume of demand. The same is true of other excise taxes. That makes them excellent economic indicators. They’re actual, total numbers, not manipulated by government statisticians with their arbitrary and usually baseless formulas.
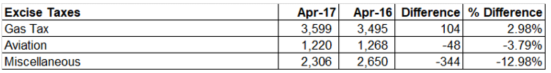
Gas taxes collected in April rose nearly 3% year to year after being down almost 1% in March and down 6.7% in February. Each of the 3 months before that were also down. Apparently, people were driving less until April. That was a sign that the US economy was not doing as well as the headlines had indicated.
So how do we explain April? Maybe people looked around and decided to take advantage of relatively low gas prices and drove more. But will that increase in driving and gasoline consumption be stimulative in the long run? Common sense told us in 2014 and 2015 that falling gas prices would have no impact on the overall US economy. Subsequent activity bore that out. When gas prices fall, people drive more, and gas sales rise. It might be good for non-integrated oil refiners, but it has no impact on the rest of the economy.
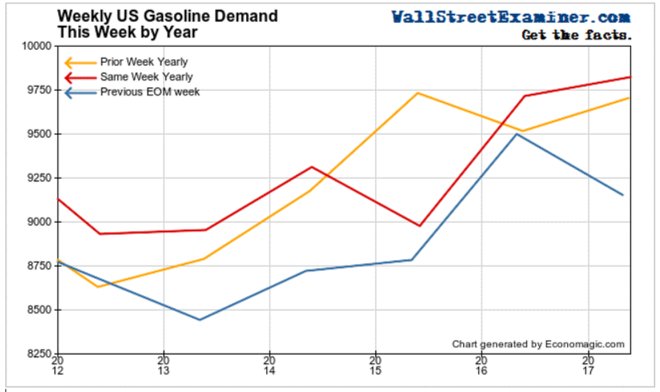
The latest weekly data from the EIA for the week ended May 26 showed gas sales up about 1% compared to the same week last year. The numbers had been persistently weak through the winter months. The strength in May followed a weak April! How do we explain the fact that gas taxes in April were up, but the EIA says less gas was sold in April 2017 than April 16?
It could be as simple as the calendar. Excise taxes collected at the end of the month are for sales through the first half of the month. The April tax collections were for mid March through mid April. The second half of March saw very strong demand. It dropped in April. Therefore the EIA’s data for April is actually a better representation of the market in real time than the Excise Tax data for the month. Gasoline demand in May was up by 1% year over year, but all of that came in the last 2 weeks of the month. May excise tax collections for the second half of April and the first half of May should be weak.
Taken as a whole, there’s nothing in this data that would suggest any acceleration in economic growth. Demand for gasoline remains soft.
Unlike gas taxes, the aviation fuel tax for April was down by 3.8%. That’s another sign that the economy remains weak, if not in outright contraction.
Miscellaneous excise taxes were down 13% year to year. These include “sin taxes” such as alcohol, tobacco, firearms, and gambling taxes, as well as telecommunications taxes. They were extremely weak. The data for May will be in the next Monthly Treasury Statement due on June 12. If sin taxes are weak again, it would be a sign that consumers are on a belt tightening campaign.
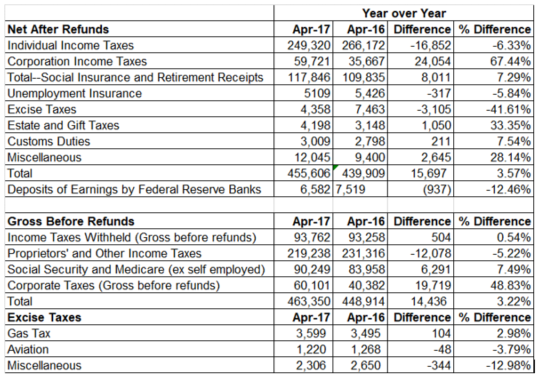
The data below is from the Monthly Treasury Statement for April. The May statement is due out on June 12. The monthly statement involves only minor adjustments to the information already published in the Daily Treasury Statement at month end. It also includes additional detail on Excise Taxes and Social Security and Medicare Taxes.
The sharp decline in net excise taxes were a result of refunds for a prior period and do not represent the status of business in April. The itemized gross collections are a better gauge of conditions for the current period. The gross taxes collected best reflect current conditions because they do not include refunds that are due to early tax periods.
The Proprietors and Other Income Taxes include small business sole proprietors and gig work independent contractors. The decline in those taxes showed that they had a bad year in 2016. The next quarterly due date for those taxes is June 15. We’ll take a look at the daily data shortly after to get a handle on how that segment of the economy performed in the second quarter.
Corporate taxes collected in April reflect Q1 profits. We already knew from the April daily statements that they were up sharply. We also know that those profits did come from sales growth. They came from squeezing workers and other cuts. Such practices, if widespread and long lasting can only result in making the US economy weaker. Someone needs to be able to buy the goods and services that US businesses produce.
Growth in tax collections against lower outlays in April that was largely due to calendar factors, resulted in a record monthly budget surplus April, slightly edging out April 2007. We already know that there will be no repeat in May. The 12 month moving average of monthly deficits has stabilized near $50 billion. That shouldn’t change much in the months ahead unless the economy weakens dramatically.
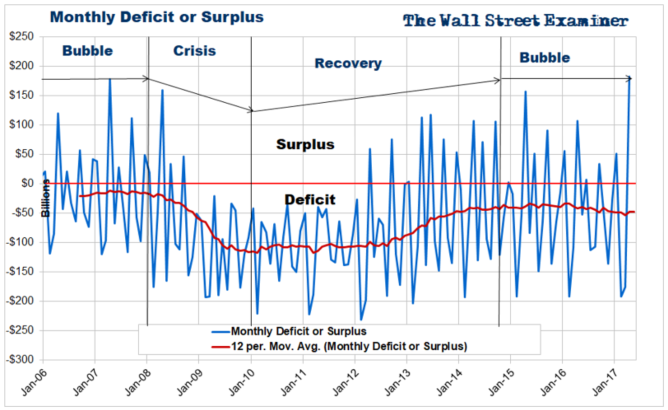
Steady deficits translate to stable monthly Treasury supply. But with the Federal debt up against the debt ceiling supply is now constrained.
The TBAC has forecast that the Treasury would need to raise $98 billion in the third quarter and spend down $85 billion of its cash. That indicates that it expects the deficit to total $183 billion for the third quarter. It expected the Treasury to borrow $59 billion in June while increasing its cash by $30 billion. Thus, it forecast a deficit of $29 billion for June. The total estimated deficit for the June-September period would be $212 billion.
With total Federal debt bumping against the current debt ceiling the government can’t borrow new money in the market. On June 1, the Treasury held $169 billion in cash. That’s not enough to make it to October when the military pension fund payment is due. The Treasury will need to raid internal funds to pay the bills. These include government pension funds, which would also need to be immediately repaid once the debt ceiling is raised to permit new borrowing.
If the impasse lasts until October, the government would need to borrow enough to cover at least $30 billion cash shortfall, with an amount greater than that depending on how much they pull out of internal government funds like pensions. It will also need to borrow enough for a cushion to bring its cash level up to normal, plus enough to cover the October deficit, which is usually around $100-130 billion. November is also a month when the government has weak revenues. The Treasury may need to borrow $200 billion or more in the space of 5 to 8 weeks in October and November. Most of that would be front loaded in October.
That will almost certainly destabilize the bond and stock markets as it did immediately after the settlement of the last debt ceiling crisis in 2015. The longer Congress puts this off, the bigger the problem will be.
This report is derived from Lee Adler’s Wall Street Examiner Pro Trader monthly Federal Revenues report.
Lee first reported in 2002 that Fed actions were driving US stock prices. He has tracked and reported on that relationship for his subscribers ever since. Try Lee’s groundbreaking reports on the Fed and the Monetary forces that drive market trends for 3 months risk free, with a full money back guarantee. Be in the know. Subscribe now, risk free!

