
The Commerce Department reported last week that “New orders for manufactured durable goods in January increased $4.0 billion or 1.8 percent to $230.4 billion. This increase, up following two consecutive monthly decreases, followed a 0.8 percent December decrease.”
Here’s how the Wall Street Journal headlined the story:
Aircraft Sales Boosted U.S. Durable-Goods Orders 1.8% in January
The rise came after two consecutive months of declining orders
Orders for long-lasting factory goods climbed last month due to purchases of military and civilian aircraft, overshadowing a weak start to 2017 for business investment in new equipment…
The Journal noted that “Economists surveyed by The Wall Street Journal had expected a 2.0% increase in total orders last month.” It also noted that the increase came after 2 months of declines. It finally mentioned perhaps the key fact in the report. “Excluding the transportation segment, orders fell 0.2% from December.” It also noted that “nondefense capital goods excluding aircraft, fell 0.4% in January.” But “Still, the broader trend remained positive. ”
Unless it’s so bad it can’t be ignored, the bad news seems to always be buried a couple of paragraphs down, and always couched in positive terms.
To its credit, the Journal’s little brother, Marketwatch.com, which is also a News Corp Dow Jones publication, gave the story a different slant, headlining:
Business investment was weak in January, durable-goods report shows
Marketwatch is a free service attempting to reach a broader market that includes market bears. However, both Marketwatch and the WSJ are News Corp subsidiaries affiliated with News Corp’s News America Marketing, whose slogan is “Your marketing objectives are our business.” Many companies and industries are News America Marketing customers, and virtually all are potential customers. That tends to result in a bullish slant to Dow Jones’s reporting.
The mainstream media reports only seasonally adjusted (SA), nominal figures, not adjusted for inflation. As often as not, seasonal adjustment tends to obfuscate what actually happened. We look at the not seasonally adjusted (NSA) data to get a better handle on reality. We also adjust the nominal data for inflation to get a better idea of the actual volume of orders. We compare that to past data on a chart to get the best picture of the current status of the trend.
On a not seasonally adjusted basis, nominal durable goods orders fell by 12.1% in January. In order to ascertain the strength or weakness of that number, we compare it with past Januarys. On that score it was the third best month since the recovery since January 2010. It beat 2016’s January drop of -13.7%. It was slightly softer than the recovery average of -11.5%. However, that average was boosted by the bungee rebound from the recession. All in all, January 2017 had an unremarkable performance.
On a year to year basis nominal orders were up 1.4%, which is still a decline in real terms. This performance was better than December’s nominal -0.4%, but was in the middle of the annual rate of change range of the past year. Again, it was unremarkable either way. What is remarkable is the degree to which stock prices have diverged from durable goods orders since 2012. It is obvious that stock prices have become unhinged from US manufacturing sector performance.
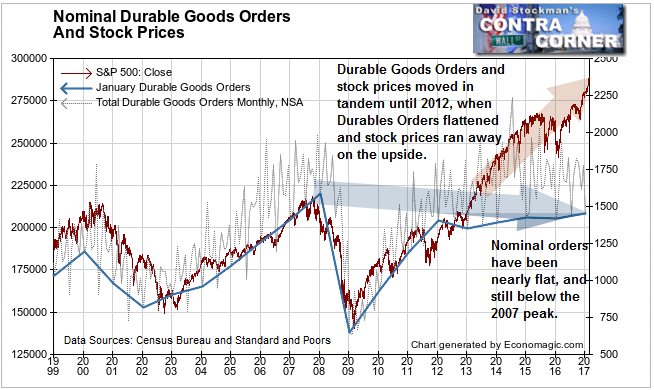
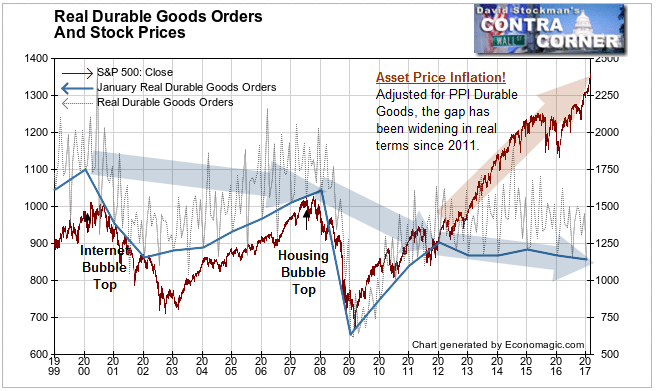
After adjusting for inflation, it’s clear that the volume of durable goods orders for US manufacturers has been dead in the water for 5 years. It remains well below both the 2000 and 2007 peaks.
The stock market advance has not been based on what the US economy produces. It has been based on speculation, financialization, and especially central bank money printing. I would go so far as to slightly modify Professor Friedman’s famous observation to read: Asset “inflation is always and everywhere a monetary phenomenon.” The separation of stock prices from US manufacturing production over the past 5 years is a perfect illustration.
Nondefense capital goods orders are a proxy for business investment, and are a measure of business confidence in the US economy. On a real, inflation adjusted basis, the actual volume NSA volume of these orders fell by 12.2% in January. That was slightly better than the 12.6% drop in January 2016. It was slightly worse than the recovery average of -11.2% for January.
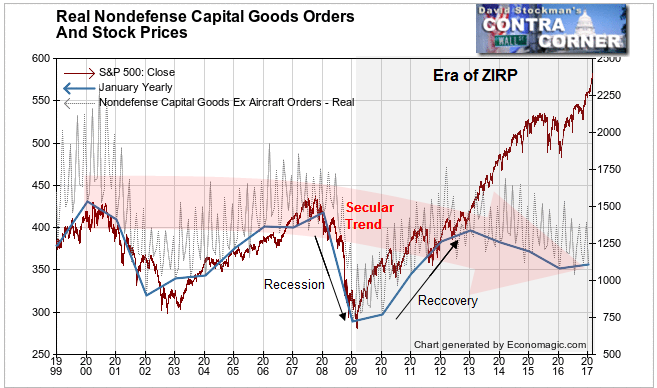
On a year to year basis these orders were up 1.2% after generally declining since 2013. I suspect that business was under the influence of Trumpophoria syndrome in January.
The real story is again in the big picture. Nondefense capital goods orders and stock prices directly correlated with one another until 2013. That’s when stock prices became unhinged from the declining secular and cyclical trend in this measure of real business investment.
The central bank experiment in asset inflation has utterly failed to stimulate real business investment. The Fed has gradually recognized its failure and is slowly moving toward a return to conventional policy.
The ECB and BoJ have not done that. They insanely continue to follow a course of proven failure. Some of the money they print continues to flow into US markets, further distorting the relationship between stock prices and fundamentals away from historical norms.
The question is whether the US economy has become so fragile that any real Fed policy tightening will cause a severe contraction in business investment. The Fed’s choice may be between allowing slow long term degradation, or triggering a crash that could possibly clear the excess speculation and allow the conditions for a return to rational real investment that helps the economy grow in real terms.
Neither course is without pain. The lack of fundamental support for stock prices will at some point trigger a Judgment Day for the stock market. Remaining invested is a high risk game. It requires constant attention and quick reaction to any sign that the market may finally be returning to a semblance of historical relationships between stock prices and economic trends.
Follow Lee’s weekly market timing reports, including ETF trading recommendations, in the Wall Street Examiner Pro Trader Market Updates. Currently open picks have an average gain of 5.5% and an average holding period of 36 days. Try the service risk free for 90 days.

