
All economics and finance can be dissolved and distilled into analysis of patterns. Whether that takes the form of a hardened, quantitative approach or something more toward the “eye of the beholder” depends on many factors. I find it useful to blend the two to find compliments and, perhaps more importantly, divergences. Oftentimes the real trick is discerning when one pattern morphs into something different.
When commentators speak of a forming rebound, as they have with retail sales and now durable goods, they are making the assumption of a new pattern based on only a couple of months. In other words, there is the expectation that current results portend an end to the persistent low-growth state that has plagued their predictions for almost exactly two years now.
The crux of March has been, essentially, that it wasn’t nearly as bad as February. That was certainly the case with retail sales, looking at them only from a month-to-month perspective with a depth of just one month. In broader context, retail sales were just as bad, if not worse, and fit within the well-defined pattern that formed after the major slowdown in 2012 (when these same commentators were making the same exact observations and proclamations).
Durable goods have turned out unarguably better in March than February, but that is an obscenely low standard of comparison and certainly not results which decisively indicate anything other than more of the same. After all, less bad is still bad.
That is what is missing from current commentary, as if the monthly volatility or sawtooth pattern is itself the most important aspect of analysis – each zig is countenanced as rebirth of “this is it”, while the zags are ignored (or blamed on snowy cold wallets) as is the relative station of all of it. As I have suggested a few times now, it is either ignorance or willful misdirection.
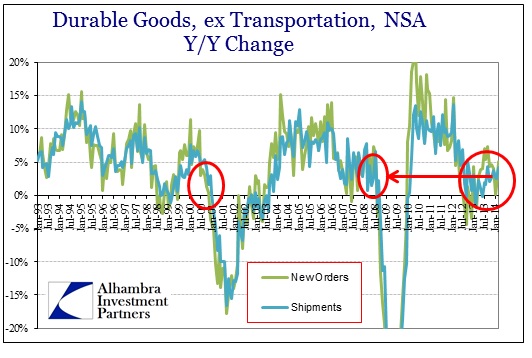
Again, the March figures are exactly what we have seen since mid-2012, including both overall durable goods and capital goods.
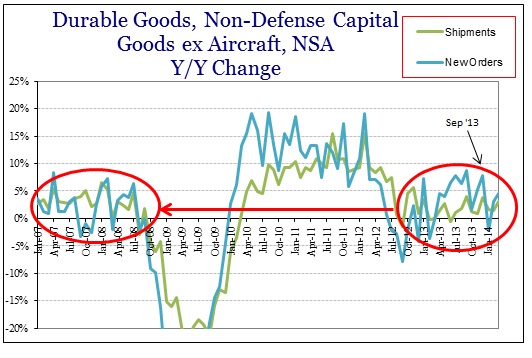
To highlight this, I have compared the current period to previous periods of inarguable growth. As with retail sales, what you see is that durable goods growth rates in the past eighteen months or so are far more consistent with the Great Recession than anything resembling a healthy economy.
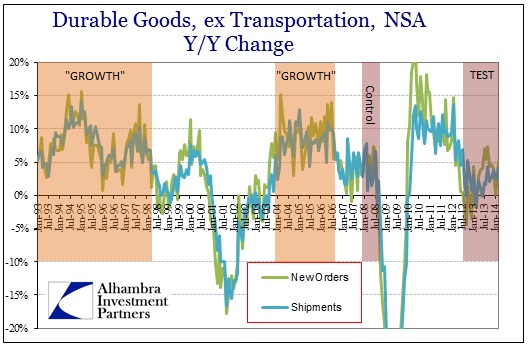
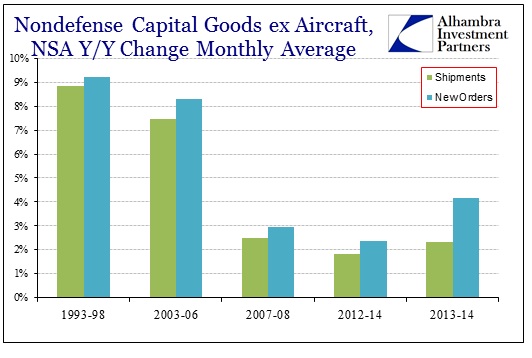
The “control” period of 2007-08 is actually December 2007 through September 2008. I used those months because they all fall within the official dates of the Great Recession itself. As I argued earlier, that portion is probably much more likely to be repeated in future recessionary episodes than the collapse that came afterward. The second “test” period refers to September 2013 through March 2014, removing some of the stain of last year’s weakness. If there is a new pattern forming indicating something substantially optimistic, it should at least appear in great contrast to the 2012-14 period – but sadly does not.
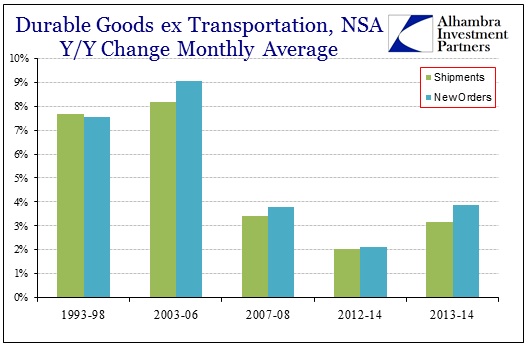
Further, while none of these figures are adjusted for price changes or some kind of inflation definition, it would make no difference. While there was energy and commodity price “inflation” in the 2007-08 period, in terms of durable goods the rate of price change was almost identical to what we see currently. Using the implicit price deflator on “PCE: Durable Goods” shows that prices fell at a compound monthly rate of -0.2% in the first ten months of the Great Recession, and at a compound rate of -0.1% since August 2012. In other words, the growth rates of durable and capital goods, both orders and shipments, are nearly identical to the Great Recession comparison across multiple factors.
In choosing to see patterns, I refer once more to the eerie similarities between the housing bubble “boom/bust” into the pre-collapse Great Recession and the recovery that has followed.
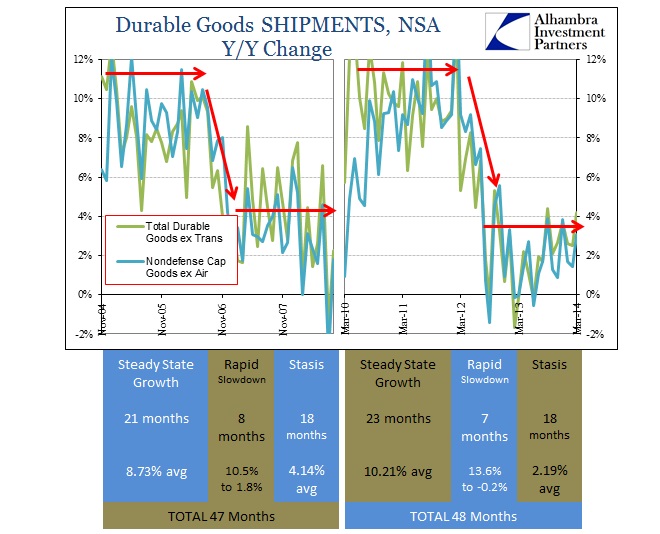
Unless we start seeing both new orders and shipments much closer to 10% than 0%, it would be very difficult to conclude that the data is saying better days lie ahead. If nothing else, these comparisons show just how far the economy would have to go to get to what is being bandied about as a certainty by the mainstream – and do so with the weight of growing and persistent “headwinds.”
Click here to sign up for our free weekly e-newsletter.
“Wealth preservation and accumulation through thoughtful investing.”
For information on Alhambra Investment Partners’ money management services and global portfolio approach to capital preservation, contact us at: jhudak@alhambrapartners.com

