
By Tyler Durden at ZeroHedge
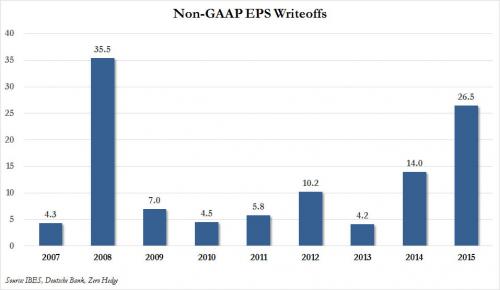
Now that Q4 EPS is almost in the history books with 494 S&P500 companies reporting, we can look at the numbers: blended 4Q EPS is $29.49 (-2.9% y/y) with GAAP EPS of $19.92. As DB admits, a 67% GAAP-to-non GAAP ratio is well below the normal ~90% ex. recessions, exacerbated by asset impairments and restructuring costs especially at Energy.
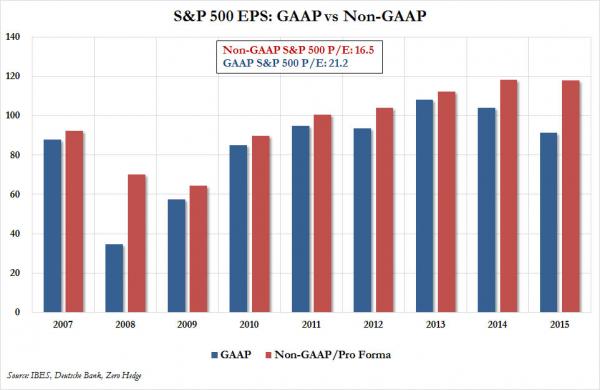
This is how DB shows this almost unprecedented divergence between GAAP and non-GAAP “earnings”:
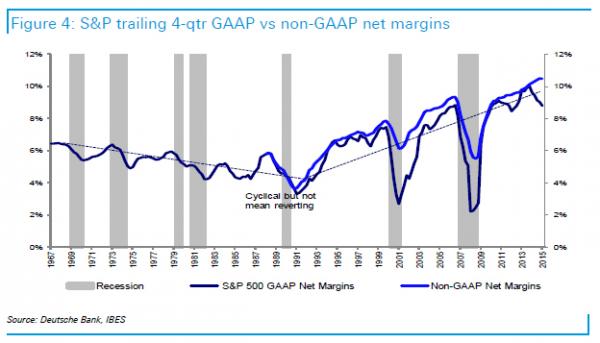
This is merely a recreation of charts we first showed one week ago, when we commented on the widest spread between GAAP and non-GAAP since the financial crisis:
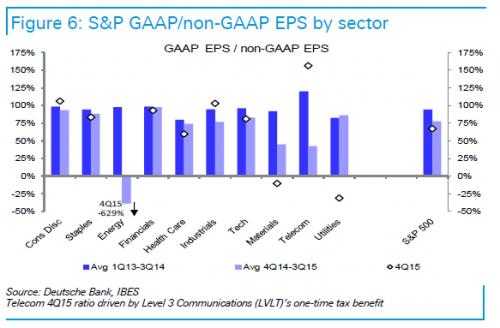
The chart below shows where the GAAP to non-GAAP divergence is most acute.
Ok, we get it: on a GAAP basis it is not a recession any more, it is a depression, just as that Houston CEO letter explained.
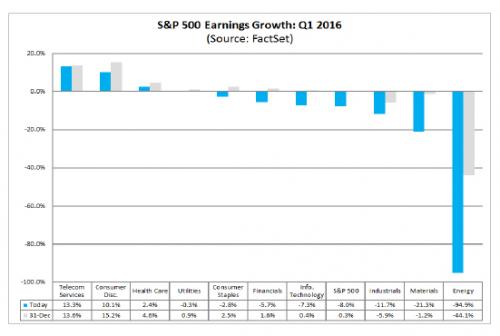
But what if we only look at adjusted, gimmicky non-GAAP? Even when looked at purely “pro forma”, things are bad. Recall that in the middle of 2015 when the full severity of the oil collapse was finally becoming apparent, the sellside was absolutely certain that the clouds would blow away by 2016, and as a result as recently as December 31, consensus expected Q1 EPS to post a modest 0.3% rise. That is not going to happen. Instead, as aof this moment, Q1 EPS is expected to collapse by a near record 8.0%, which would be the biggest annual decline since Q3 2009.
To all those saying “it’s all just energy”, we would say “yes… and 6 other sectors” as shown in the chart below. In fact, as of this moment, the only industries which are expected to post an EPS increase in Q1 are Telecom, Consumer Discretionary and Healthcare.
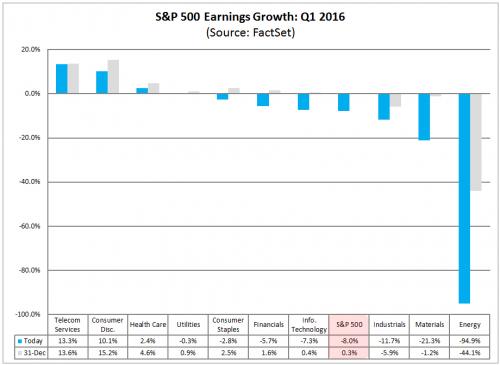
The estimated earnings decline for Q1 2016 is -8.0%. If this is the final earnings decline for the quarter, it will mark
the first time the index has seen four consecutive quarters of year-over-year declines in earnings since Q4 2008
through Q3 2009. It will also mark the largest year-over-year decline in earnings since Q3 2009 (-15.7%). Three
sectors are projected to report year-over-year growth in earnings, led by the Telecom Services and Consumer
Discretionary sectors. Seven sectors are projected to report a year-over-year decline in earnings, led by the Energy,
Materials, and Industrials sectors.
So four consecutive quarters of declining earnings, or two earnings recessions back to back: recall what JPM said last night: “periods of consecutive EPS contractions are often followed by
(or coincide with) economic recessions (~80% of the time over the past
~120 years).” What about periods of two consecutive earnings recessions?
Don’t answer that, because it gets worse:
During the first two months of Q1 2016, analysts lowered earnings estimates for companies in the S&P 500 for the
quarter. The Q1 bottom-up EPS estimate (which is an aggregation of the estimates for all the companies in the index)
dropped by 8.4% (to $26.69 from $29.13) during this period. How significant is an 8.4% decline in the bottom-up EPS
estimate during the first two months of a quarter?During the past ten years, (40 quarters), the average decline
in the bottom-up EPS estimate during the first two months of a quarter has been 3.6%. Thus, the decline in the
bottom-up EPS estimate recorded during the first two months of the first quarter was larger than the 1-year, 5-year,
and 10-year averages.In fact, this was the largest percentage decline in the bottom-up EPS estimate over the first two months of a quarter
since Q1 2009 (-24.0%).
As the WSJ summarizes it “Wall Street’s earnings estimates for S&P 500 companies are falling at the fastest pace since the height of the financial crisis.”
As for the guidance, it is is just as abysmal:
Guidance: Negative EPS Guidance (79%) for Q1 above Average
At this point in time, 115 companies in the index have issued EPS guidance for Q1 2016. Of these 115 companies,
91 have issued negative EPS guidance and 24 have issued positive EPS guidance. Thus, the percentage of
companies issuing negative EPS guidance to date for the first quarter is 79% (91 out of 115). This percentage is
above the 5-year average of 72%.
In other words, we are about to have our 4th consecutive annual decline in S&P earnings. And here we make a bold prediction: while Wall Street traditionally expects a sharp hockeystick into outer quarters, which explains why consensus expects a 1.8% increase in ful year earnings, down from 4.3% at the start of the year…
… we on the other hand are calling Q2, Q3 and Q4: the next three quarters will all post EPS declines, in non-GAAP and most certainly in GAAP numbers, leading to an unprecedented 8 consecutive quarters in declining S&P500 EPS. Actually precedented: the last time it happened was during the Great Depression.
Only this time it’s not even a recession, because when you “exclude energy”, add a near record number of non-GAAP addbacks, and hockeystick the result, everything is quite ok.
Source: Non-GAAP Earnings are About to Plunge the Most Since 2009; As For GAAP Don’t Even Ask… – ZeroHedge

