
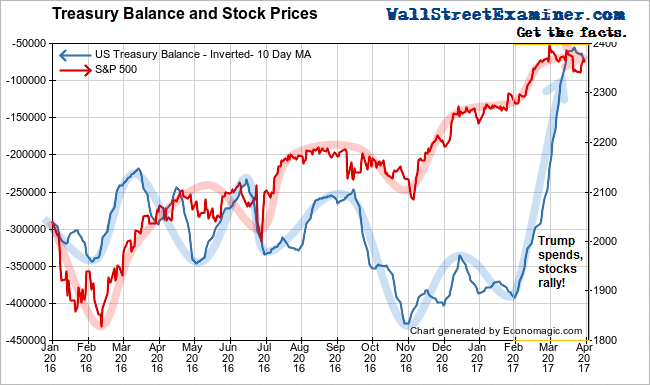
Well, he did it. He spent it all. Don Trump spent that $382 billion windfall that the Obama Gang transferred to him on January 20. It took less than 2 months.
We’ve seen the results in higher stock and bond prices and will probably soon see it in the March economic data. It will very likely surprise to the upside.
We know that because Federal Withholding tax collections had a huge bump in March. It’s coming back down now, but the surge worked.
But now the Treasury is out of money, and the debt ceiling will prevent the Don from increasing spending until a deal is done. Rest assured that he won’t be able to spend an extra hundred bill per month like he did from January 20 to March 20. That money is gone. The stock market and economic bump that grew out of it is also done. Now the market and the economy must adjust to a big reduction of Federal Government spending and debt paydowns.
But now the Treasury is out of money, and the debt ceiling will prevent the Don from increasing spending until a deal is done. Rest assured that he won’t be able to spend an extra hundred bill per month like he did from January 20 to early March. That money is gone. The stock market and economic bump that grew out of it is also done. Now the market and the economy must adjust to a big reduction of Federal Government spending and debt paydowns.
When the Treasury spends extra cash for discretionary outlays, it would typically goose the economy a little. But when it spends cash to pay down debt, that’s a direct injection into the financial markets. It retires some debt. The erstwhile holders of that debt, which includes dealers, banks, and other institutions get cash in exchange for the maturing paper. They use some or all of that cash to reinvest in the remaining existing supply of Treasuries, other fixed income securities, and stocks. That’s enough at the margin to push the prices of those securities higher.
I plot the Treasury balance on an inverted scale to show the direct correlation between changes in the Treasury’s cash balance and stock prices.
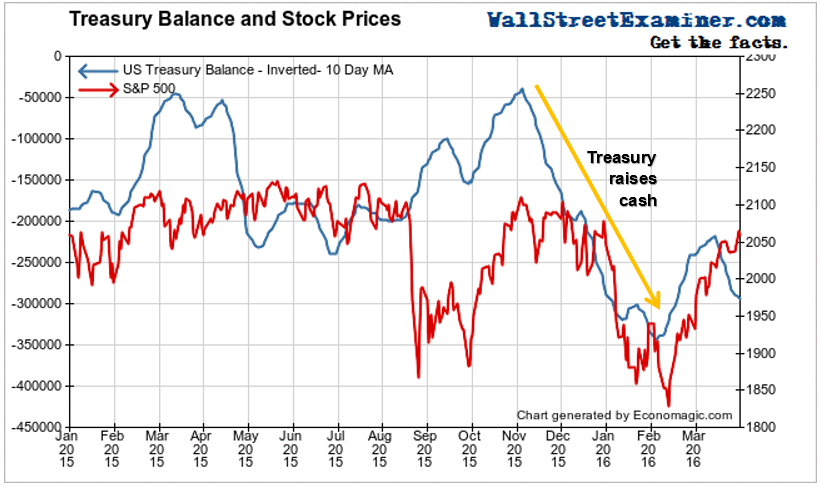
It works in reverse. When the Treasury was building that cash hoard, there were several periods where it raised a lot of cash by selling additional debt. That pulled money out of the market and stock and bond prices fell. You can see that in the September-November period of 2016.
There was a much bigger impact when the last debt ceiling crisis ended in October 2015. The Treasury went on a borrowing binge from November 2015 through February 2016 after the deal was made to suspend the debt limit.
The Treasury had taken cash from government pension funds and other internal funds down to zero. When the deal was done to suspend the debt ceiling at the 11th hour, the Treasury needed to refill those accounts quickly. To do so it raised several hundred billion in new debt over the next few months. That not only refilled the accounts that they had robbed, it was also used to build up the Treasury’s cash for the next “rainy day.” That triggered a big plunge in stock prices.
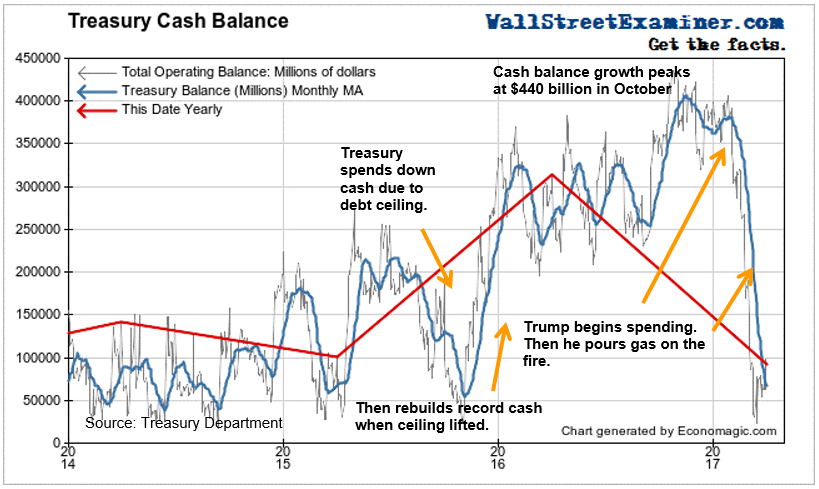
Obviously this isn’t the only market influence, but they were swinging hundreds of billions of dollars during this two year period in building up and drawing down this fund. The historical norm for Treasury cash is the sub $100 billion range. If they now keep Treasury cash below $100 billion it will cease to be a major factor in driving the markets. The cash won’t be there to drive rallies. But if they do decide to rebuild the “rainy day fund” it will be ugly for the market.
As of March 1, 2017, the Treasury’s cash balance was $92 billion. That was $222 billion less than on the same date in 2016. Don Trump spent it all. Treasury balances are back to their normal range prior to the big cash buildup of 2015-16.
With cash low and the debt ceiling back in place, the Treasury must raid government pension funds and other internal accounts to pay the bills. When that cash runs out is when a deal to raise the debt ceiling can be expected.
Withholding Tax Collections Surged
Withholding tax collections had an inexplicable spike in March. Looking at the shorter time span, the rise started from a low in early February and trended radically higher until the second week of March.
The moving average line has a lag, but shows the general shape of the cycle.
The comparison is the same period year to year. Therefore this is not a seasonal fluctuation. The waves vary in timing and amplitude, as well as duration. They reflect normal short term fluctuations in economic activity.
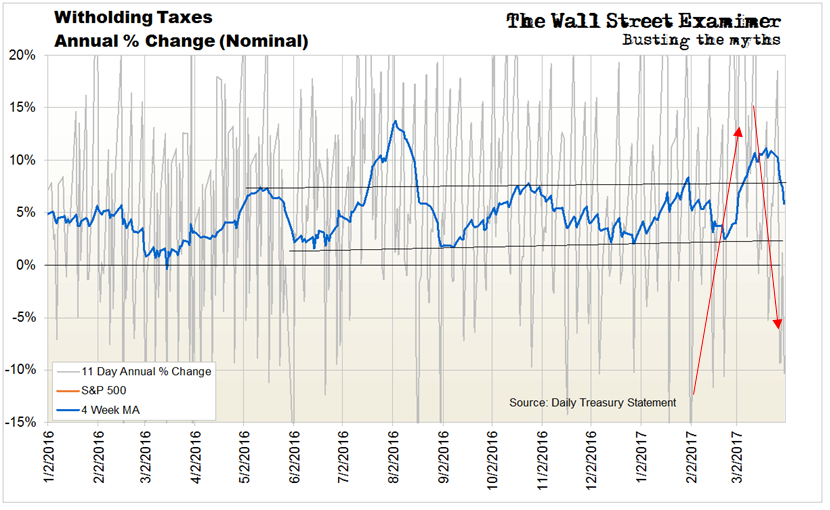
By the second half of March withholding taxes were back within their usual range of the past year. This is similar to a surge in collections last July.
I could not find an explanation for either spike. The first was transitory, and collections returned to trend. I assume that will be the case in this instance. However, if the moving average line stays above the lower trendline on this pullback, then it would suggest that we should look for stronger economic data.
If that happens, it will encourage the Fed to move more quickly to tighten policy. The Fed is finally starting to discuss shrinking its balance sheet. I warned several years ago that when we see news of such preparations being made public, then that would be the time the Fed was beginning to get serious about a real policy tightening, instead of just these make-believe Fed Fund rate hikes.
The current nominal growth rate in withholding over the past month is now around 6.6%. Adjusted for wage gains, that would suggest a real growth rate of around 4-4.5% for March. Over the past 3 months the average nominal gain has been +6%. That suggests a real gain of around 3.5% to 4%. Based on withholding taxes, the economy apparently heated up in a burst of euphoria upon the installation of Don Trump as head of the Washington DC Mafia. But given that the Treasury is now out of cash and must stop spending at least temporarily, that economic burst was a one shot deal.
This would be a good time to sell.
This report is excerpted from Lee Adler’s Wall Street Examiner Pro Trader Federal Revenues Report.
Lee first reported in 2002 that Fed actions were driving US stock prices. The US Treasury has also played a role in directly moving markets. Lee has tracked and reported on those relationships for his subscribers for the last 15 years, helping to identify major turning points in the markets in their earliest stages. Try Lee’s groundbreaking reports on the Fed and the Monetary forces that drive market trends for 3 months risk free, with a full money back guarantee. Be in the know. Subscribe now, risk free!

