
It’s payroll day again, which means we get to watch the straight-line march of the Establishment Survey “confirm” whatever the observer wishes to infer because a straight line is both uninteresting and mostly not useful. This happens, of course, regardless of what other parts of the survey or other surveys show. The most prominent disagreement continues to be with the Household Survey, diverging conspicuously in October 2012. We can also add the labor force, which flattened out also in October 2012, as well as one other data point (below).
The headline numbers were all exactly in line with previous months, which should stand out as something askew more than act in confirmation. The economy certainly doesn’t move in a straight line so it stands to reason there should be more than a little lumpiness to payroll changes even including adjustments.
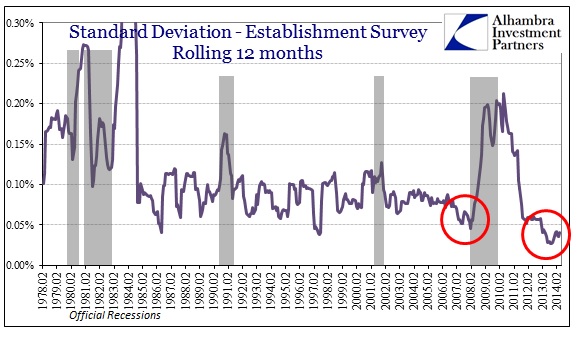
Ever since the start of 2013, the Establishment Survey has become more of a straight line than at any time in its history.
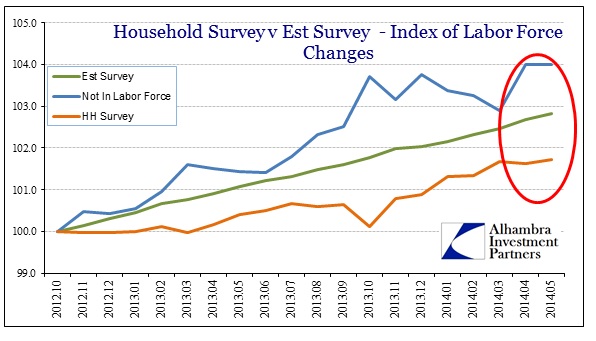
Going back a few months before, it was there that the Household Survey began to “undercount” employment, at least by comparison. While the mainstream position places far greater faith (which is what it is) in the more quoted Establishment Survey, the other parts of the payroll report disagree – and some vehemently.

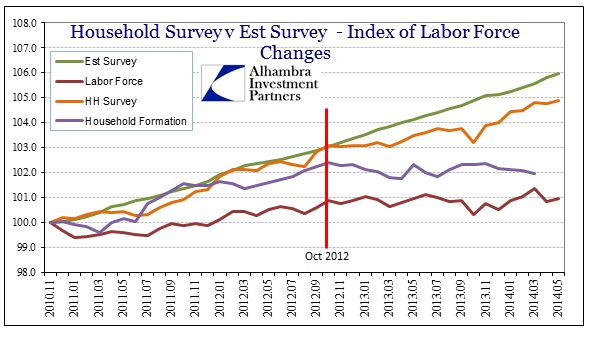
As I have shown in previous months, prior divergences between the two surveys were typically small and never endured for very long. The last 20 months have been highly unusual to say the least. However, the somewhat healthy increases in the official labor force flattened out right around that same month. In fact, the labor force in October 2012 was 155.5 million, and is estimated to be 155.6 million in today’s release. Measuring from January 2013, when the Establishment Survey’s straight line grew straighter, the labor force is actually 86k fewer in number.

This is highly irregular as well except during periods of open contraction. It is not just the labor force that shows this trend, either, as I noted earlier this week household formation has dropped significantly in the past year or so. Adding that data point to the mix reinforces this interpretation, particularly as the change in trend dates once again to about October 2012.
This is beyond random coincidence and mere population characteristics. How can it be related to population when the Household Survey, an alternate measure of employment, picked up the same exact inflection at the same exact time? The only way to tie these factors together and maintain logical consistency is to look to the macro economy as something other than what the mainstream indication is being used for .
Putting household formation together with the unadjusted Establishment Survey shows this divergence perhaps even clearer.

While there was a significant divergence (in the other direction) back during the dot-com recession of 2001, I think that is far more easily explained via the housing bubble that was then just heading toward full mania. Even with that, household formation eventually tripped up in late 2002 as job growth (and the stock market FWIW) persistently underwhelmed. Once the economy gained traction, artificial as it was, the synchronization between household formations and the Establishment Survey is pretty noticeable just visually.
If this was the only example of discrepancy I would be far more open to the population excuse, but there is no end to the economic data points that show a large and persistent slowdown right in 2012 where this chasm opens. Is it logical to simply assume that businesses have been hiring at exactly the same pace throughout, with no variation whatsoever? The straight line is all the more questionable when you factor in the latest estimates of actual business results, particularly smaller businesses that seem to have suffered a huge profit setback recently.
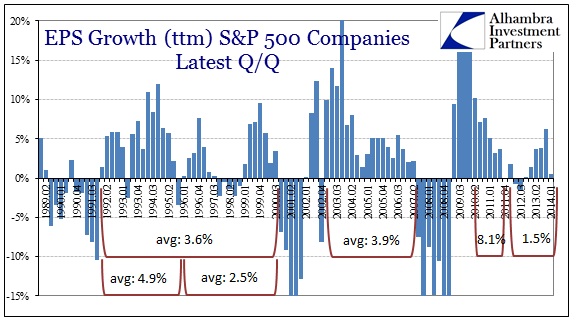
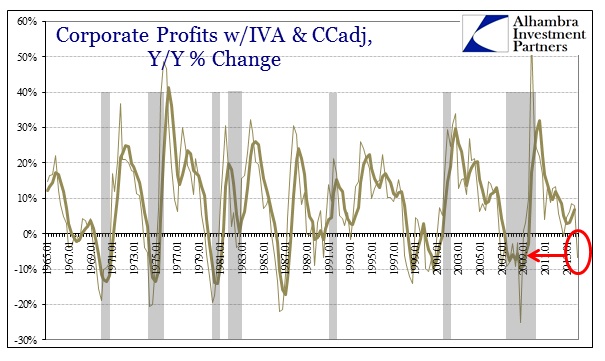

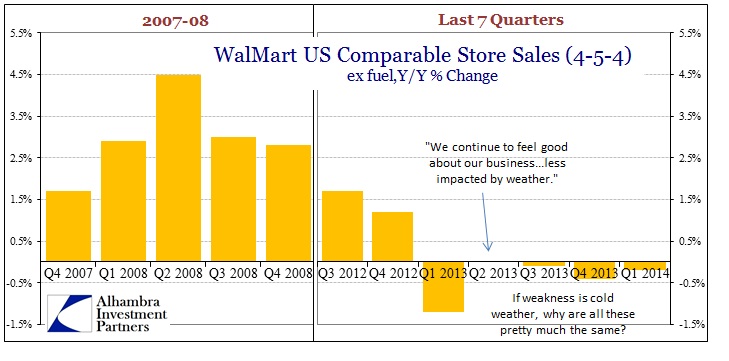
Cash flow and profits are down to levels, once again, associated with recession while people are dropping out of the labor force and giving up living on their own (especially net of population growth), but this economy with those exact factors is producing a steady, if lackluster, stream of new jobs? I think it more likely that there are huge problems with the payroll surveys, particularly in this “recovery” where the previous statistical constructions are simply inappropriate. Even WalMart’s struggles here are so decisive.
Click here to sign up for our free weekly e-newsletter.
“Wealth preservation and accumulation through thoughtful investing.”
For information on Alhambra Investment Partners’ money management services and global portfolio approach to capital preservation, contact us at: jhudak@alhambrapartners.com

