
January Home Sales Reach Highest Level in a Decade, Realtors Say
Supply of existing homes remains historically low
U.S. home sales rose in January to the highest level since February 2007, a sign last year’s momentum in the sector extended into 2017 despite a limited supply of properties-for-sale and rising prices.
That’s how the Wall Street Journal presented today’s press release from the National Association of Realtors (NAR) covering previous home sales that went to closing in January. Typically those sales went under contract 30-60 days prior to the closing.
We should note that Dow Jones, which publishes the Journal, is the sister company of Realtor.com, the online marketing platform for the NAR. That’s right. News Corpse (honest news is dead), which owns the Journal, owns Realtor.com. It also owns News America Marketing, whose slogan is, “Your marketing objectives are our business.” News Corp. recently offered all of its reporters at the Journal buyouts so that their jobs could be replaced by PR bots and press release drones working out of New Delhi, not New York.
In short, don’t expect straight news on home sales from the Wall Street Journal.
I looked at this month’s data from my perspective as a former commercial real estate appraiser, former mortgage broker and, 100 years ago, real estate broker. I did not come to the same hysterical headline conclusion as did Dow Jones News America Marketing, whose handiwork we saw in the Journal’s headline and lead.
Since the current NAR release covers sale closings it’s essentially irrelevant. That’s because the NAR released sales contract data (what it misnames “Pending Home Sales”) for December, 3 weeks ago and November 7 weeks ago. Because all but a handful of those sales close within roughly 60 days, we already know roughly what the number of closings should be.
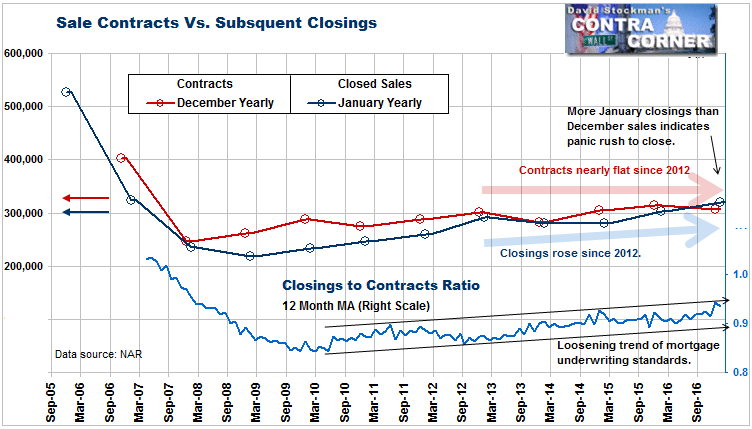
Furthermore, closings are formalities. Buyers, sellers, and agents all consider a property sold when the contract is signed. Otherwise, why would they change the Sale sign to a Sold sign. Just because it takes 4-8 weeks to complete the paperwork and turn over the keys doesn’t make the closing data significant. It’s a footmark; although it’s interesting to compare the number of contracts with the number of subsequent closings. That tells us something about market conditions, which I’ll get to. But first, the numbers.
I stick to the actual numbers, as opposed to the seasonally adjusted (SA) obfuscation favored by economists and the Wall Street media. The SA data attempts to present a smoothed, idealized version of the trend of the data. Truth be told, sometimes it does. But alas, sometimes it doesn’t, and we can’t know which is which unless we look at the actual data graphed on a time series chart. Voila, we can see the trend for ourselves. Do a little technical analysis and we can see precisely where the market has been and where it currently stands. We might even be able to tell something about the future.
Closings fell in January by 117,000 units from December. That’s not as bad as it sounds. January is always a down month. The previous two Januarys saw declines of 134,000 and 132,000 respectively. But the January declines of this year and the previous 2 years were all the worst since the beginning of the housing crash in 2007. Year to year, closings were up by 6%. And yes, it was the most December closings since 2006, but that misses the point.
The real point is that the ratio of closings to the prior month’s contracts was more than 100%! That indicates that there was a rush to close some January contracts in January. It means that underwriting standards had reached their easiest level in the 10 years of data that I have at my disposal. It is unheard of for there to be more closings than previous month’s sales. Call it a closings panic.
What that means in addition is that the sharp drop in contracts from November and December and the accelerating of some closings from February to January is likely to result in a terrible “existing home sales” report for February. My bet would be that it will break the uptrend in closings. I also suspect that the data on January contracts coming up in a week or so, will clearly break the 9 year uptrend in contracts.
So it’s true that closed sales were at the highest level they have been in a decade. And it’s true that the momentum of the number of closings has increased. But is that a good thing?
No.
When closings exceed the previous month’s sales, it means that something is wrong. Underwriting standards have reached the point of ridiculous and dangerously easy. Buyers and appraisal values are being approved which under normal circumstances would not be.
Likewise, buyers, sellers, and lenders are radically shortening the time between contract and closing in some cases. There’s a reason they’re rushing. Rising mortgage rates are making it tougher to do deals. Lenders are compensating for that by easing underwriting standards. These actions are accelerating sales from what would have been the future into the present. This is robbing demand from the future. That’s going to show up in the data sooner rather than later. When it does, the financial media and investors are going to get one hell of a surprise.
The behavior of this data suggests that, from a fundamental point of view, this would be a good time to start shorting housing stocks. But from my point of view as a technical analyst, I want to be sure that my reading of the charts and technical indicators confirms before I jump in on the short side. That is especially the case for buying puts, where mistiming is usually fatal to that trade.
Follow Lee’s weekly market timing reports, including ETF trading recommendations, in the Wall Street Examiner Pro Trader Market Updates. Current picks have an average gain of 8.3% and an average holding period of 40 days. Try the service risk free for 90 days.

