
Last week the NAR reported the number of closings of previously sold homes. They call the report “Existing Home Sales.” It is true that they are existing homes, but the count does not show the number of sales. It shows those that have closed or settled. The sale happens when the contract is signed. That’s when theirs a meeting of the minds between buyer and seller, and when the price is established. All parties to the deal agree that the property is sold, including the Realtor who puts up a SOLD sign on the property. Buyers in the market, consider the property sold.
Conversely, what the NAR calls “Existing Home Sales” is, in reality, the number of closings, when keys change hands, the buyer is given a deed and paperwork is filed with the local government. In essence, it’s a formality. Usually around 90% of all sales close.
The NAR’s “Pending Home Sales” report gives us an index which tells us the actual number of sales in the previous month. “Existing Home Sales” are sales that typically happened 1-3 months ago, with most done 6 weeks to 2 months before the closing.
In that sense, the “Existing Home Sales” report is a useless appendage to what we already know, except for being useful as part of a measure of housing market frothiness. The higher the ratio of closings to prior sales, the frothier the market. In the late stages of a housing “boom,” or “bubble,” underwriting standards drop and more sales are rushed to closing. There is no one level where we can say the market is finished. Suffice to say that any month where more than 100% of average number contracts entered over the previous 2 months is probably overheated and near a top.
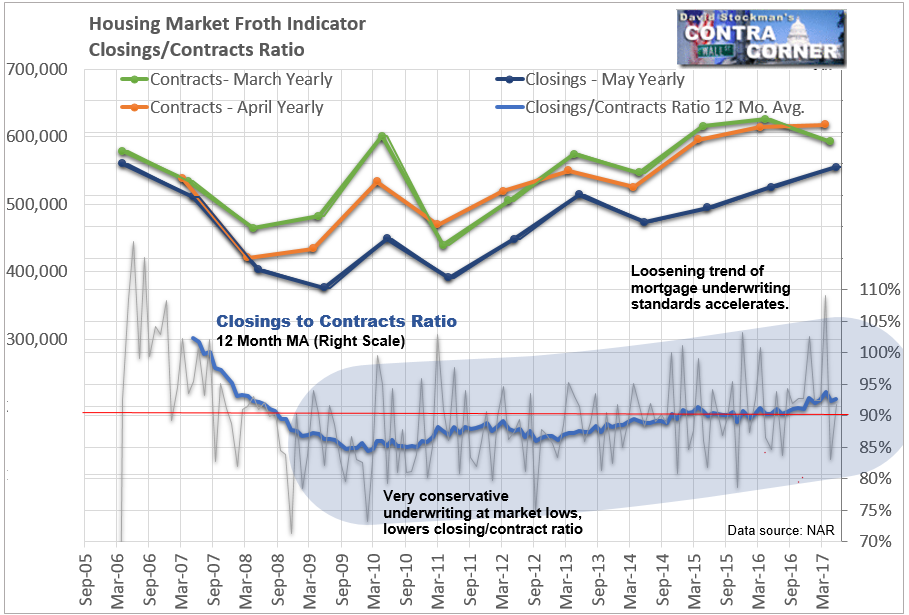
Likewise, when the 12 month average of closings to contracts is at 95%, that’s probably unhealthy. It would be the mirror image of the bottom of the housing crash, when the 12 month average of sales to closings was hovering around 85%. That level suggested that underwriting standards had become overly conservative at the market bottom.
The current numbers hit more than 100% in one month twice in the past 6 months. The first time was in December, after mortgage rates had shot up after the October all time low in rates. Buyers, sellers and lenders were in a panic approving questionable credit, pushing appraisers to hit the contract value, and rushing deals to settlement before rising rates scuttled them. Not coincidentally, that panic temorarily halted the rise in mortgage rates. It did not end the sizzling hot inflation of house prices.
I must interject here that no economist, nobody in media or pundit community, and certainly no one in the housing businesses calls house price inflation what it is. Instead of “inflation,” they universally use euphemisms like “growth, rise, increase, appreciation,” to draw attention away from the fact that housing inflation is raging. The BLS doesn’t even include housing inflation in CPI. The BEA doesn’t use it in PCE. They create phony substitute measures which deliberately understate housing inflation. That tactic alone has kept PCE perpetualy below the Fed’s 2% target. If housing inflation had been counted properly, PCE would never have been below 2%. Today it would be almost double that.
As usual, I checked how the NAR’s partner the Wall Street Journal handled this news. News Corp. which owns the Journal also owns Realtor.com. That website is the online marketing arm of the NAR, listing virtually all of the properties for sale in the NAR’s MLS services around the country. The Journal reported that, “The median sales price in May was $252,800, the highest nominal level on record and up 5.8% from a year earlier.”
Apparently prices higher than the peak of the Great Housing Bubble, inflating at a 5.8% annual rate, are not in any way alarming. It’s all good. Instead they talked about how wonderful the American drive to own a home is. The news report was packed with quotes from industry insiders touting the market. It was pure PR. The only negative they saw was that supposedly there’s just not enough inventory on the market.
Maybe the appearance of shortage has something to do with artificially subsidized demand, thanks to the Fed still supporting mortgage rates at near record lows. For now…
That will change when the Fed starts shrinking its balance sheet in a few months.
Here’s how the current housing inflation looks on paper. In a word, steady.
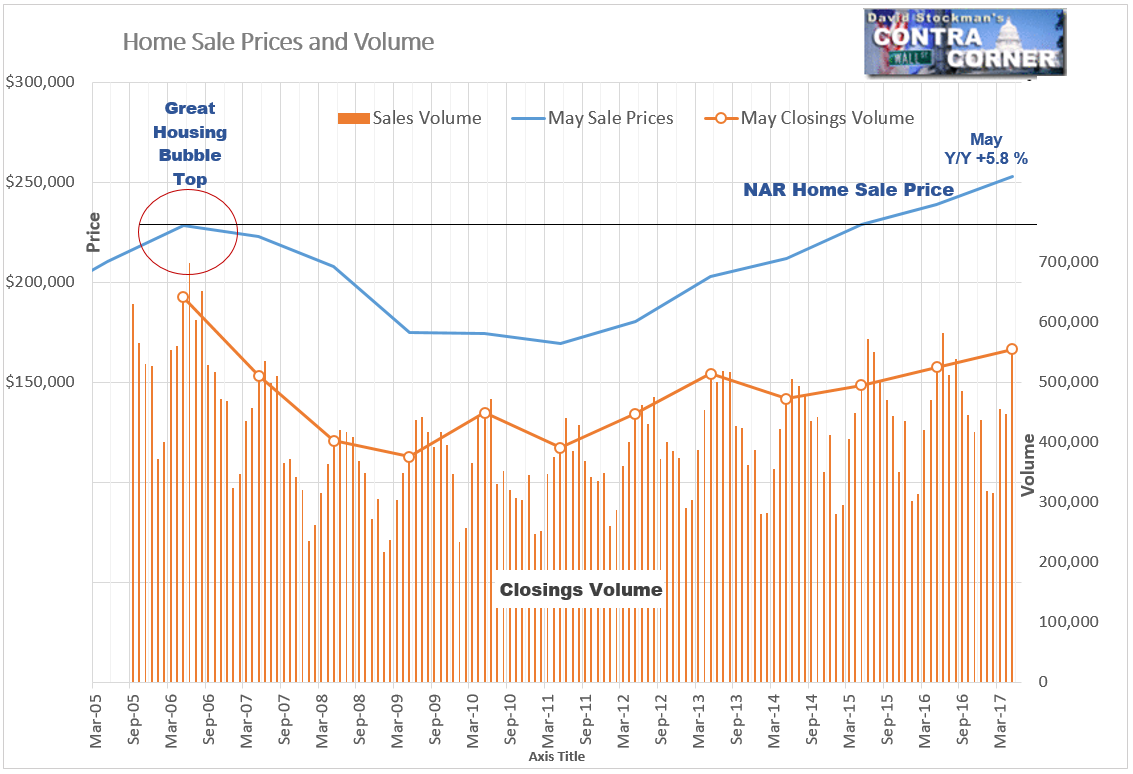
It’s also clear that there’s a correlation between prices and volume. Today, closings volume seems to be holding up. The NAR reported a 2.7% annual gain comparing seasonally adjusted May data for this May versus last May. Using seasonally adjusted numbers to compare the same month in any year to year comparison is among the worst practices of the statisticians and economists who tout SA numbers. But in this case a calendar adjustment is appropriate as calendar factors pushed some closings from April to May. So an actual 5.7% year to year gain on the basis of the not seasonally adjusted data for May, became a 2.7% gain in the headline number.
But is that even close to accurate. We can judge whether it is by using 2 month data for April and May, which eliminates the calendar anomaly of the shift of sales from April to May. April-May sales were only 0.7% above the April-May 2007 level. That’s about in line with population growth. It’s a sharp deceleration in the growth rate, which was approximately 5% a year ago and 8% as of May 2014. The growth rate now is barely positive as buyers increasingly struggle to qualify for mortgages. Incomes are failing to keep pace with inflating home prices.
Notably, volume collapsed from 2006 to 2007, well ahead of the crash in prices.There’s great potential for a similar sequence of events today.
Mortgage rates should start rising later this year. There will be a double whammy pusing rates higher. The debt ceiling will be lifted and the Fed will start shrinking its balance sheet by not rolling over all of its maturing debt holdings. The Treasury will be adding a huge increase in supply on to the market as a result of these factors.
The increase in supply will cause bond prices to fall and yields to rise. Mortgage rates will go up along with bond yields.
When that happens housing demand should collapse just as it did in 2007-08, as far fewer buyers will be able to qualify to purchase. When demand collapses, prices will follow. This will be a double barreled catastrophe for the housing market. It will put mortgage issuers and guarantors back in crisis mode as the value of their collateral plunges.
The complacency in the stock and bond markets today is a sign that few investors are paying attention to the forces that will lead to crisis. The sharp slowing in the number of homes sold is a signal that this slowing will turn to contraction when mortgage rates rise.
This is an opportunity for you to reduce your exposure while the markets are still orderly. If you have the chops for action on the short side, now would probably be the time to place bets against bonds, MBS, interest sensitive and housing related stocks.

