

As we dig through S&P 500 price forecasts for the year 2017, we discover that a majority of “Wall Street’s top strategists”, are calling for a year-end S&P 500 price in the 2,300-2,450 range. None of the forecasters expect a down year, but that’s an article for another day. Not surprisingly, a year-end index price in the aforementioned forecasted range would put growth in line with that experienced since 2012. While the strategists will claim they have extensive multi-factor models that help them arrive at their estimate, it is quite likely many of them rely on extrapolating prior price performance into the future based on the dangerous assumption that the future will be like the past.
Such a forecasting strategy may seem logical, and has worked well for the last four years, but it fails to acknowledge that earnings growth, which have repeatedly been grossly over-estimated, have been relatively flat over the same period. Since 2012, the S&P 500 has risen almost 70% while earnings are up a mere 2%. The graph below plots the S&P 500, earnings per share and their respective trend lines.
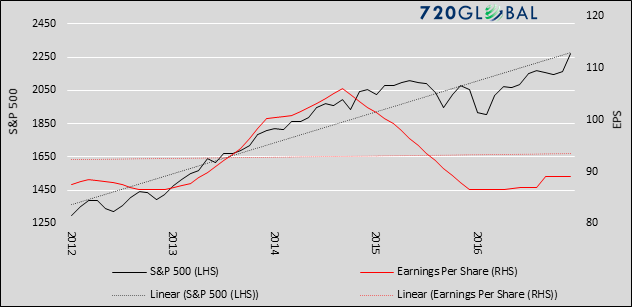
Data Courtesy: Bloomberg and Standard & Poor’s
When price increases are not accompanied by earnings increases, it indicates that multiple expansion has occurred. In other words, the ratio of price-to-earnings (P/E) is expanding almost entirely because of its numerator- price increases.
Whether or not an observed expansion of the P/E multiple makes sense depends upon the context. Such a situation may be justified when valuations are at or below the long run average, but keep in mind that current valuations are at levels that have rarely been eclipsed in history. The current P/E multiple is not just above average, it is 70% above the average of over 130 years of observations. For those that follow the consensus expectations, we suggest that you also extrapolate expected returns for ever increasing valuations. The graph below plots the S&P 500 and expected ten-year annualized returns. The expected return is calculated from the regression of monthly Cyclically Adjusted Price to Earnings ratio (CAPE) and the associated annualized returns that occurred over the following ten years. The data encompasses 130 years’ worth of data.
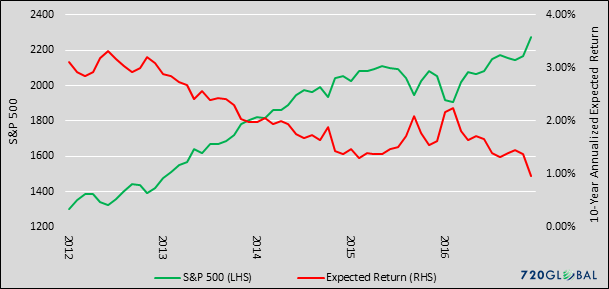
Data Courtesy: Bloomberg and Standard & Poor’s
It is plausible that earnings will increase at a healthy clip and valuations will normalize. However, if we are to extrapolate prices like the so-called experts, then to be consistent, that same logic should also be applied to earnings and expected returns. Expected returns, having trended lower since 2012, are now forecasting a sub-1.00% annualized return for the next ten years.
This brief note is a simple reminder that extrapolating price without considering future earnings trends and valuations is a fool’s game. Extrapolating the past is relatively harmless for street prognosticators. Basing an investment strategy on such a plan, however, can have severe financial repercussions.

