
Real time daily Federal tax collection data compiled from the Daily Treasury Statement, and slightly delayed data from the Monthly Treasury Statement, are probably the best indicators of the US economy. They’re actual, total monies taken in by the Internal Revenue Service for a variety of taxes. They are real time or near real time. They are not based on surveys. The data isn’t seasonally, or otherwise statistically manipulated. This data invariably correctly tells us where the US economy currently is, and how it is trending.
Subsequently released, lagging economic data virtually always confirms that the tax data is the real thing. It may take the economic releases a month or two or three to get around to reflecting that data, but ultimately it gets there. So why bother with that nonsense when you can pay attention to the real thing? If you already know what’s coming, you can position yourself accordingly, but not because the economy drives markets. If you know where the actual data is and where the economic consensus is, you know when the two are disconsonant, and the market will be surprised. That opens up trading opportunities.
But more importantly, the tax data tells us early on whether the Fed is likely to continue to work toward its stated policy goals, or whether the Fed is out of step with economic reality, as is usually the case. Then we can have our antenna up for when the Fed will change direction, and prepare our trading plan accordingly.
As we know from the previous report on this subject, May withholding tax collections decelerated sharply. That signaled a weakening economy after a jobs surge in April. True to the tax data, the jobs data for May confirmed. If withholding tax collections continue to decelerate in June, June jobs data should be even worse. Ultimately the question will become whether that forces the Fed to change course away from its stated intention to start shrinking its balance sheet in the not too distant future. That would indubitably be bearish, and should end the massive bubbles in asset prices of all kinds, stocks, bonds, housing, commercial real estate–everything.
From a bearish perspective, to finally put an end to this insanity, it would not be a good thing if the economy slows too much too soon. That could encourage the Fed not to tighten. If the economy weakens too much, it might even cause the Fed to bring back QE, which could worsen the market distortions and expands the bubbles to even greater extremes, leading to an even more violent adjustment when one finally arrives.
Picking up where we left off the other day, “The May plunge has broken the low of the April pullback. As a technical analyst first, any time I see a lower low after a lower high, my antenna goes up. This could be a forerunner of trend change.”
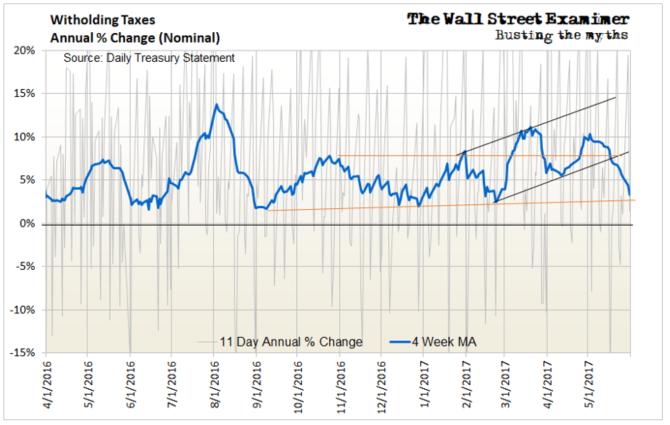
A drop below the late December lows around +1.9% could be significant. If it happens and jobs data goes negative, it would probably cause the Fed to detour away from any thought of shrinking its bond holdings. If the withholding taxes hover around 2% nominal growth, that would imply zero real growth. That would keep the Fed on pause. If they turn negative, the Fed could restart QE.
However, the Fed has made clear recently that it has its eye on asset prices. They’re worried about the bubble in stocks. If stock prices rally on weak economic news because traders expect the Fed to restart QE, the Fed will have created a Catch 22.
If withholding tax collections rebound to stay strongly positive, look for the Fed to announce its plan for reducing the size of its balance sheet within the next couple of Fed meetings. That would be bearish. However, history has taught us that the market usually does not change direction until the policy is implemented, not when the Fed simply talks about it. Money talks.
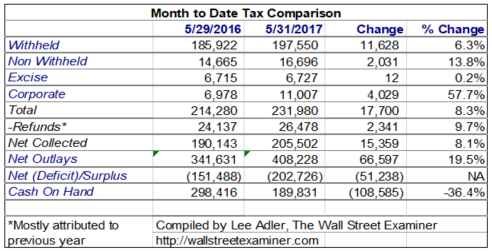
Other Daily Treasury Statement Tax Data
Withholding taxes for May from the end of month Daily Treasury Statement rose 6.3% versus May of 2016. However, all of that was due to the calendar. The last business day of the month in 2016 was the 29th, which meant that tax payments for the last 2 days of the month were not reported until June 1 last year. With plenty of retail businesses open, and some end of month payers waiting until June 1, that pushed significant revenue into June last year. This year, it showed up on May 31.
The 4 week moving average method is not impacted by calendar month differences. It showed a year to year gain of 4.3%. The end of month year to year gain in April by the 4 week average method was 9%. The April-May change was a huge deceleration.
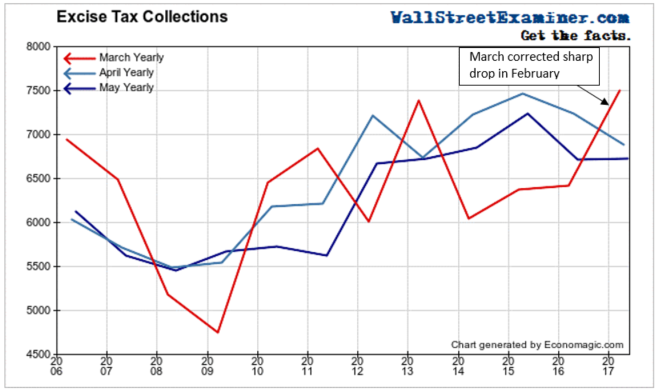
Excise taxes
Excise taxes collections were weak in May. They have been weak for the past year. They are collected from large payers twice a month with a half month lag, with smaller payers less frequent. The calendar would have had no impact. They are collected on a cross section of goods, and suggested that the US economy remained weak in both April and May.
Excise taxes in May rose by 0.2% year to year. April was down 4.8%. March was up sharply but that appeared to be a result of a big underpayment in February. Taken together, February-March were flat from 2016.
That followed declines of 2.6%, 2.9%, and 6.3% over the November-December period with similar declines going back to May of last year. The persistence of the negative numbers in this series raises real questions about the true underlying strength of the US economy.
These numbers tell us that the US economy has been weak despite the strength in jobs in April. The job gains are another instance of “Employers are always the last to get the news, because they take their cues from the stock market.”
The weakness in April excise taxes had forewarned us that the April job gains that we correctly inferred from the withholding taxes could not be sustained. The level of final sales simply cannot support continued high levels of hiring. In fact, they don’t support any hiring. The hiring that employers have done in recent months has all been speculative in the face of weak sales. Now both the May withholding tax data and the just released Nonfarm Payrolls report for May have signaled that employers may finally be coming back to earth.
The April excise tax data also correctly foreshadowed that sales and production related data for April would be weak. Now another soft report of excise taxes again suggests weakness in final demand in May. That showed up in the May auto sales data for May which was just released.
The direction of this data suggests that the handwriting is on the wall for the end of this expansion. Then the question would become whether that deters the Fed from its plan to try to prick these asset bubbles by shrinking its balance sheet. Of course, in their hubris, the Fed expects to be able to engineer a soft landing. They should be so lucky. These bubbles are stretched way too thin for that. The instability is coming. Only the timing is at issue.
This report is derived from Lee Adler’s Wall Street Examiner Pro Trader Monthly Federal Revenues Report.
Lee first reported in 2002 that Fed actions were driving US stock prices. He has tracked and reported on that relationship for his subscribers ever since. Try Lee’s groundbreaking reports on the Fed and the Monetary forces that drive market trends for 3 months risk free, with a full money back guarantee. Be in the know. Subscribe now, risk free!

