
Whether it’s because they just don’t understand reality, or just want to always walk on the bright side of life, The Wall Street Journal and its cohorts managed to serve up another case of positive spin on dismal economic data this week.
U.S. Factory Orders Up 1% in February
WASHINGTON–U.S. factory orders rose in February, a sign of steady demand for American-made goods.
Orders for manufactured goods increased 1% to a seasonally adjusted $476.49 billion, the Commerce Department said Tuesday.
Wow. 1% a month! That’s 12% annually! Fortunately they didn’t annualize in this case. Many seasonally adjusted releases do, which has the effect of multiplying any seasonal adjustment error by 12. But a 1% gain in a month does sound phenomenal.
Then there’s the Journal’s kid sister Marketwatch phrasing it this way:
Factory orders rise in February for seventh gain in eight months
That makes it sound as though these gains are persistent and part of a trend. But dig a little deeper and suddenly the picture doesn’t look as hot as the headlines would lead you to believe.
On a not seasonally adjusted basis, the actual numbers appear to be so so. Historically, February is usually an up month. It was up in 8 of the past 10 years. The prior 10 year average for the month was +2.3%. February of 2016, which had a leap day, was up by 4.8%. This year, February had a gain of 2.6%. By the standards of the past 10 years, it was… meh. And even had last year not had a leap day, this February would still have been weaker than last February.
The annual growth rate this February was 3.5%. That’s a decent gain, but it includes inflation. We’ll get to the inflation adjusted basis in a moment. The nominal number was weaker than January’s year to year growth rate of 5.7%.
All told, the actual not seasonally adjusted numbers do not indicate any great error in the SA data. On the surface there appeared to be a little growth.
But beauty is only skin deep. Plotting the raw data on a chart with a couple of trendlines and an annual rate of change shows us what’s really going on. In this case, the trend peaked in 2014. The downtrend has yet to be broken in spite of a year long counter trend rise in the seasonal lows.
There’s also a downtrend in the growth rate over an even longer period, going back to 2010. That trend also appears to be intact, in spite of a recovery from the 2015 low. This recovery hasn’t even gotten orders back to the levels of 2012, 2013, or 2014. In fact, it’s not even back to the 2008 level.
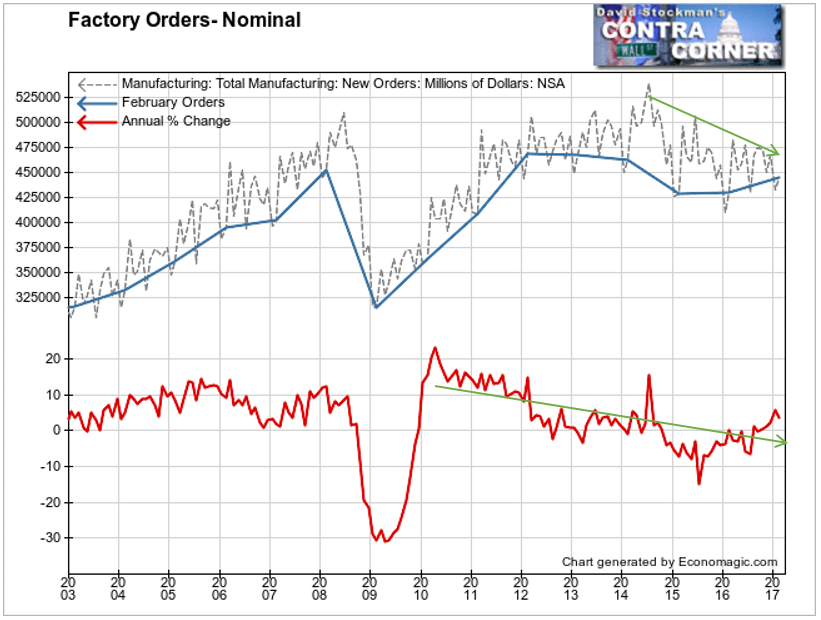
That was after the Great Recession had already begun. Apparently corporate purchasing managers were late in getting the news. “Hey Guys! We’re in a recession!”
It should make you question why the media pays so much attention to the ISM survey of purchasing managers every month. I mean, really! Talk about behind the curve. These clowns are even worse than hiring managers at figuring things out.
They’re always looking beyond the valley. “Next month things will rebound back to normal,” they think. Except that sometimes it doesn’t work that way. The long, slow deterioration we see in many data series isn’t just a valley. It’s long term secular rot driven by too much debt and too many perverse financial incentives. Utterly ridiculous low interest rates and wave after wave of central bank money printing promoted those perverse incentives.
We have identified the false narrative and we can see the facts with our own eyes. Even with the benefit of including 9 years of inflation in the data, we’re still below the levels of the 2008 peak. So what happens if we back out inflation and look at the data in real terms? The secular rot becomes even more clear.
There was a solid secular uptrend until 2008. The last 2 years of that uptrend began with the top of the housing bubble, and continued with everyone in the mainstream media and big business expecting it to return. Only it didn’t. Instead, we had a crash. Then we had a rebound. Which we would have had even if the Fed hadn’t panicked and printed money out the wazoon and cut interest rates to the point of committing financial genocide on America’s senior citizen savers. After all, when hasn’t the US economy recovered from recessions.
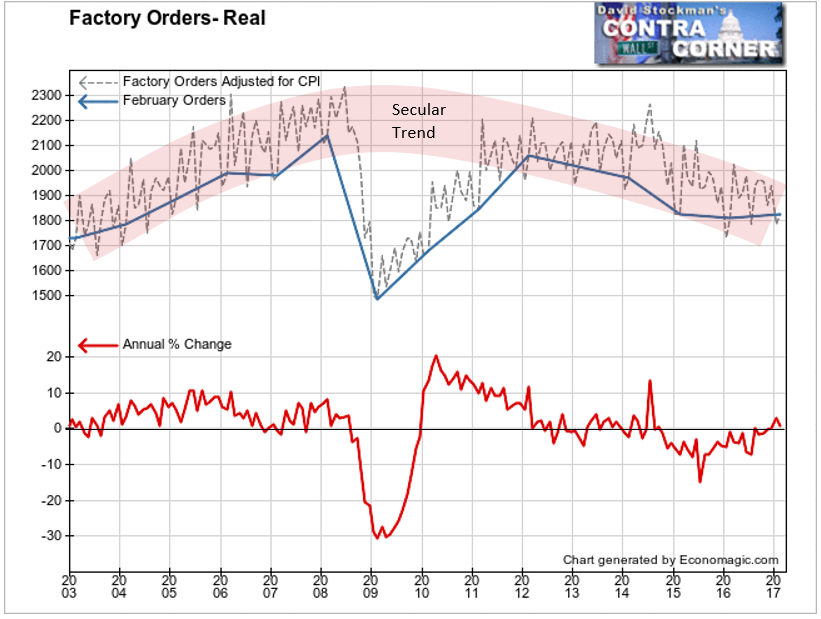
We had 3 years of a solid rebound, but real factory orders never made it back to the prior secular peak. That peak may have been the blowoff to mark the permanent end to US long term secular expansion. Because since the rebound stalled in 2011, we’ve had 5 years of nothing. Instead of continued growth, and even with massive monetary stimulus, orders to US factories have been in a long period of stop-start decline. It appeared on the surface that things stabilized over the last two years, but there can be no doubt. The curve of the big trend continues to weaken.
The Fed has utterly failed to stimulate growth. Instead, years of monetary madness have created perverse financial incentives leading to massive, embedded malinvestment. This has come at the expense of the virtuous, hard working savers who believed in the old time values of hard work and saving their money. They avoided the central bank run speculative financial shell games.
Now the Fed has thrown its hands up and said, “We give up! We’re going back to the old time religion! We’re going to return interest rates to a level that will provide, if not a healthy return on rational investment, at least some return. We’re going to do it slowly to ease the disruptions to the maladjusted, malinvested financial system that we screwed up.”
But it won’t ease the disruptions. It will only prolong the pain. The Fed is now going to make us pay for its sins.
Don’t be a victim of the unwinding of the Fed’s latest and greatest long term serial blunder. Prepare for a big, bad bear market. Take your chips off the table. We can mitigate the risk, and probably profit by holding some gold.
We can also profit by shorting stocks when the market rallies to key resistance levels. I have been putting on pilot short positions over the past couple of weeks with stops just above the recent highs. I’ll be watching these picks closely, and looking for more in the days, weeks, and months ahead.
Follow Lee’s weekly market timing reports, including ETF trading recommendations, in the Wall Street Examiner Pro Trader Market Updates. Try the service risk free for 90 days.

