
A few days ago I examined the relationship between the stock market PE and CPI inflation. The reason was the sudden renewed emphasis on low inflation in the context of trying to justify increasingly outlying earnings multiples in stocks. Earnings fell sharply in 2015, but prices really didn’t; there was, at most, only more volatility spread across sideways trading (even including recent record highs). EPS haven’t as yet recovered and there are growing signs that risks to the earnings recovery have only increased, not decreased. By simple math, then, stocks are trading on very shaky ground at already high multiples and greater uncertainty that it will all be corrected naturally by the any-day-now thriving economy; leaving prices as the more likely motivated method for convergence.
Inflation is but one of the inappropriate attempts to justify high PE’s; as one reader pointed out (thanks to RUI), there is also the interest rate comparison to the stock earnings yield. The inverse of the PE is the EP ratio, which is supposed to be a relative comparison of stocks to bonds. The current PE ratio, according to Robert Shiller’s data, is an alarming 23.7 as of the latest earnings, which are for December 2015. Since earnings haven’t improved much at all since then, while prices are somewhat higher, the valuation imbalance has likely grown worse over the interim.
But if you flip the ratio around, the so-called earnings yield is a “healthy” 4.21%. Compared to a 10-year UST yield around 2% at the time, and now much less, the EP theory would imply that stocks are not at all overvalued in comparison to UST’s. You might even go so far as to suggest stocks have a lot of room for even more multiple expansion.
This theory was popular during the dot-com bubble, and much less so after it. It had been around for some time, but Alan Greenspan testified to Congress in February 1997 that:
Analytically, current stock-price valuations at prevailing long-term interest rates could be justified by very strong earnings growth expectations. In fact, the long-term earnings projections of financial analysts have been marked up noticeably over the last year and seem to imply very high earnings growth and continued rising profit margins, at a time when such margins are already up appreciably from their depressed levels of five years ago.
Because he was then still the “maestro”, thus was born the “Fed model” as merely this earnings yield concept repackaged as if given official imprimatur from the one man Wall Street admired the most. It was used quite often to justify the dot-com bubble as anything but a bubble, forgetting that the basic relationship between UST rates and forward earnings expectations isn’t so clear – and especially so in history outside the 1990’s.
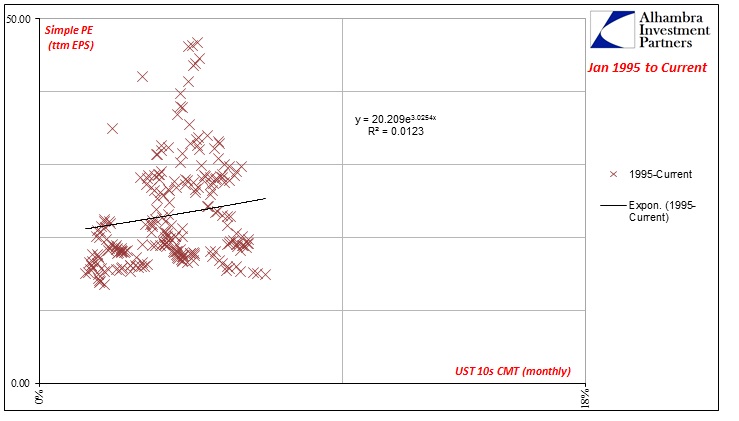
Unfortunately, I don’t have historical data for forward earnings at each interval in time, so past earnings will have to be a sufficient substitute (and I am going to regress the 10-year monthly UST CMT yield against the market PE, which is mathematically no different than the EP). What we find is remarkably similar to the (lack of) relationship between PE and the CPI. There just isn’t any evidence to suggest stock valuations relate much to interest rates, and therefore that the latter can or ever does imply anything about the former.
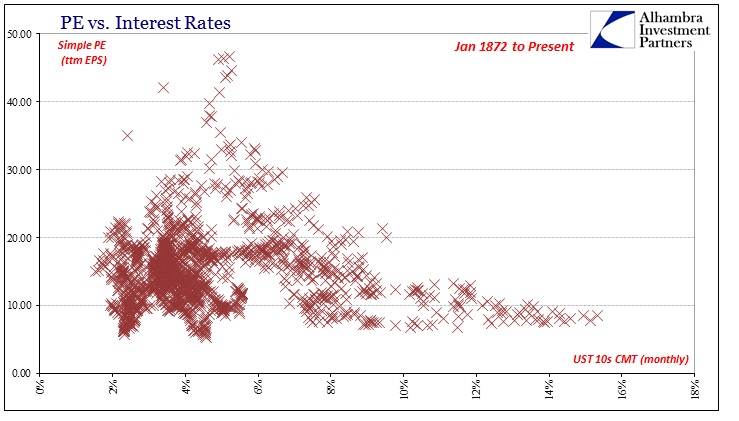
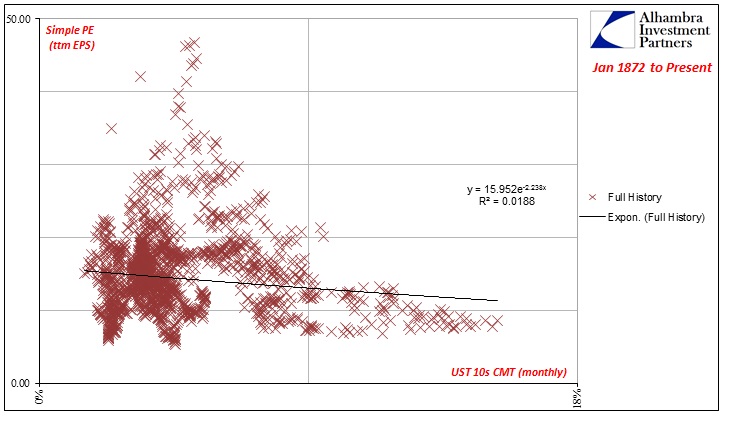
Notice that the regression model doesn’t predict any PE less than 11 nor any greater than 16; there is just no correlation to be found.
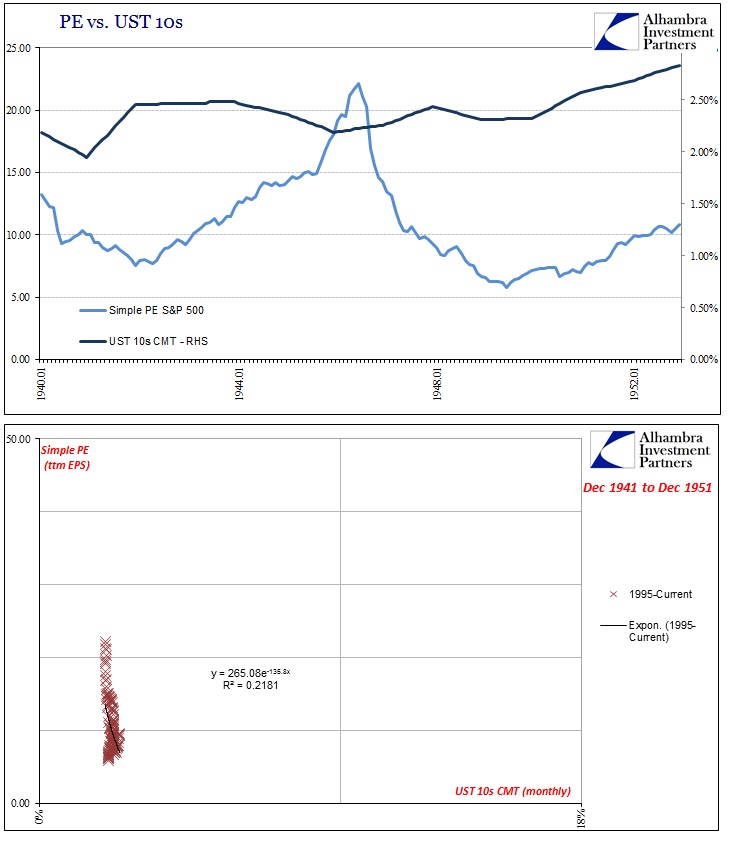
There are a couple points in history that illustrate as consistent examples this lack of definable relationship very well. With the onset of WWII, following the Great Depression, the Federal Reserve was tasked with broadly pegging UST rates as part of the war effort. From April 1942 forward, the Fed imposed a 2.50% cap on long-term Treasury bond rates. Until 1947, however, bond rates remained steady on their own, requiring very little of central bank purchases to enforce the rate ceiling. The reason was the separate commitment to purchase T-bills at 3/8 %. Because of “overvaluing” bills relative to bonds, the public accumulated treasury bonds while the Fed accumulated T-bills, providing a seemingly very stable financial platform for the war and beyond.
In July 1947, bills were no longer pegged and the Fed (though for only a short while) was forced to buy significant quantities of bonds to keep the rate ceiling intact. It was only with the “independent” Fed battle over the Korean War in 1951 when rates were finally allowed to be determined, relatively speaking, more by market forces (“even keel” remained in effect right on into the Great Inflation a decade later).
In relation to stocks, it implies “loose” and again stable monetary policy that would seem, like the 1990’s, to suggest a greater possibility for increasing valuations especially relative to steady bond yields. Rather than finding even a hint of correlation, however, what we see instead is no relationship at all. As the 10-year bond rate held steady, the market PE rate was all over the place; rising to above 20 by 1946 before falling all the way back to 5.8 by 1949 (and the recession that year) before rising yet again into the 1950’s.
The most charitable time period for the possibility of the earnings yield comparison for stocks is, as the CPI and inflation, the post-1965 environment. But the same interpretation also applies here; meaning that the most that can be said about it is that during the Great Inflation interest rates tended to be higher while stock valuations tended to be lower and nothing more.
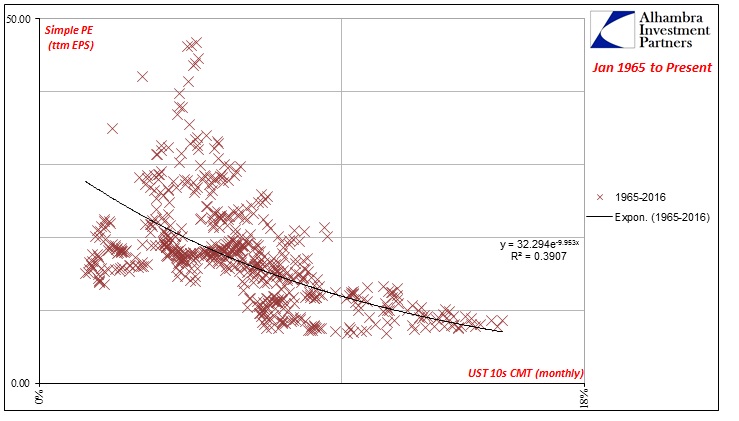
Even then the weak correlation is less convincing than it appears because the relationship particularly after the dot-com bubble turned to bust completely broke down. There is actually so little correlation 1995 and forward that the regression flips! In other words, the exponential regression model shows a positive slope, meaning that from 1995 to the end of 2015 there is a very, very weak positive correlation that would suggest higher PE’s with higher interest rates. That actually makes relatively more logical sense given that ultra-low rates indicate nothing good about the intermediate term economy and corporate environment (or even longer-term already, since, contra Keynes, it seems we have reached the long run and we aren’t dead – but the economy still is). Thus, it would seem more positive for stock valuations if interest rates actually normalize, moving higher, not lower.
That is, of course, imposing a qualitative bias on the data where, again, no significant relationship can be found statistically. There is just nothing to suggest interest rates are related to PE’s or EP’s, and thus the “Fed model” was but another 1990’s gimmick to justify the unjustifiable.
The fact is that stock multiples move all over the place predicated on factors not always (ever?) related to fundamentals; as if that were an insightful statement. If the economy of the dot-com bubble, the one the Fed confused in the 2000’s with a permanent uptick in productivity, had actually continued without interruption Alan Greenspan would (might) have been right in 1997. It didn’t because that economy was an illusion, as were the stock prices that fed into it (and in many ways fed it). These supposed valuation comparisons were then nothing more than trying to work backward to a predetermined conclusion; as they would be now.

