
“U.S. Pending Home Sales Surged in Warm February ,” the Wall Street Journal reported on Wednesday. Reporter Ben Luebsdort added:
“A gauge of upcoming U.S. home sales firmed in February.
The National Association of Realtors pending home sales index, which tracks contract signings for purchases of previously owned homes, climbed 5.5% in February from the prior month to 112.3, its highest level since April 2016 and the second-highest reading since May 2006. “
The Wall Street Journal is a sister company of Realtor.com and News America Marketing, whose slogan is “Your marking objectives are our business.”
First of all, “Pending Home Sales,” (PHS) is not a gauge of upcoming home sales. It is a measure of actual current sales in the month prior to the release, based on contracts recorded in regional Multiple Listing Services (MLS) and tabulated by the National Association of Realtors (NAR). Sales are entered and reported by the MLS as soon as the property is sold, which means as soon as it goes under contract between buyer and seller.
That’s when the sale sign goes up. It’s when the buyer, seller, and agent consider the property sold. The closing is virtually a given. Generally less than 5-6% of all contracts fall through. When the ratio is higher than that, it’s a sign of an overheated market.
The idea that the recording of the subsequent closed sale is when the sale actually happens is ludicrous. By the time the sale is recorded and reported by local governments, the data is already stale. The widely followed Case Shiller Index is even staler by the time it is reported. At the time the Case Shiller is released it is 5 1/2 months behind the time the sales took place. It is useless as a tool for gauging current market conditions.
I like the PHS measure because it’s as close as we can get to evaluating the US housing market in real time. At the same time, the median sale prices reported by the NAR in conjunction with its reporting of closed sales, are also based on the MLS contract data for that month. Why they report the two data sets separately is a mystery to me.
But I’m happy to combine the most current pricing data with the most current sales volume data chart. Then I analyze the chart as a technical analyst, not as an economist. I don’t pretend to be an economist any more than I pretend to be a used car salesman.
When the February number was strong sales are not really trending higher as the WSJ reported. I look at the not seasonally adjusted (NSA) data, because it is the actual data. The media reports only the seasonally adjusted (SA) impression of what the trend would look like if seasonal variance is statistically manipulated to look like a smooth curve. That representation of reality is misleading as often as not. The only way to judge whether it is or not is to look at the actual numbers, that is, the NSA data.
Month to month, sales rose 23% from January. That sounds spectacular but February is always an up month. February 2016 was even better, helped by that leap day. It was up 29.4%. February 2015 was the last time the month had 28 days. It was up 21.4%. The current performance was merely in line with recent trends.
When we compare the numbers on an annual basis, again, the trend doesn’t look as bullish as the Wall Street Journal’s PR minions would have you believe. Sales were down 1.9% from February 2016. That’s not as bad as it sounds because last year had that leap day. Considering that, this year’s number shows a nominally higher sales pace than in 2016. Looking back at 2015 which, like this year, also had 28 days, this February’s sales were only 2.5% higher than February 2015.
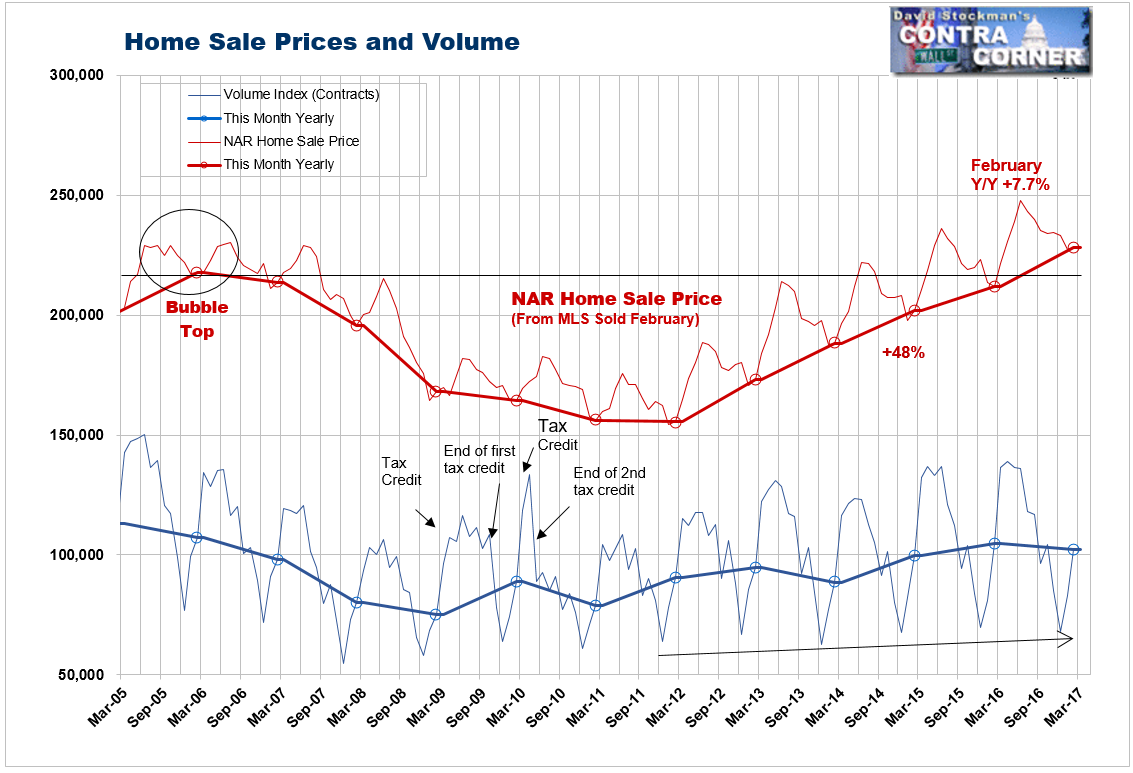
Home prices are rising sharply, a manifestation of raging inflation. Sales have yet to break the uptrend, but volatility in volume has increased over the past 2 years as the Fed’s MBS purchases continued to support record low mortgage rates. That in turn subsidized both housing demand and housing inflation. The inflation offset any savings that would have resulted to buyers as a result of the low rates. Total mortgage payments did not decline.
When mortgage rates have upticked in recent months we have seen sales pull back. In December, sales fell 2% year over year, after mortgage rates jumped in November. That indicates that sales have reached the limit that buyers can afford at the current combination of prices and mortgage rates. The slowing rate of sales over the past 2 years is another indication that buyers are stretched to the limit.
If mortgage rates stay at or below recent levels, house prices will probably continue to inflate. That will cause steady decay in demand as fewer and fewer buyers will be able to afford rising mortgage payments. The market will die slowly. By the same token, a resumption of the rise in mortgage rates would be likely to kill the market quickly. Sales would collapse, and ultimately so would prices.
Mortgage rates are edging lower at the moment because the debt ceiling means that no new Treasury supply will be coming to market until Congress and Don Trump can make a deal to lift the ceiling. Temporarily reduced supply means temporarily higher prices and lower yields for Treasury bonds and mortgage backed securities (MBS). But as soon as there is a debt ceiling deal, supply will come flooding back into the market. MBS prices will fall and mortgage rates will rise.
What looks like slow death now could lead to a sudden collapse when the deal is done. The uptick in February sales is meaningless. My message is unchanged. Avoid housing stocks, and if you’re a trader, sell them short when they rally to resistance.
Follow Lee’s weekly market timing reports, including ETF trading recommendations, in the Wall Street Examiner Pro Trader Market Updates. Currently open picks have an average gain of 9.2% and an average holding period of 39 days. Try the service risk free for 90 days.
Follow Lee’s weekly market timing reports, including trading recommendations, in the Wall Street Examiner Pro Trader Market Updates. Try the service risk free for 90 days.

