
As usual, the mainstream media spun the news on housing starts last week as great news. Indeed the numbers were strong for the month, but the data contains a hidden warning about what comes next.
The Wall Street Journal went right to the seasonally adjusted fiction and stayed there, once again not bothering to examine or report the actual, not seasonally adjusted numbers. They were astounding. But the reason the Journal gave for the strength was superficial puffery, perhaps a product of the Journal’s sister units, Move Inc., which runs Realtor.com, and News America Marketing (Your marketing objectives are our business).
U.S. Housing Starts Jump 25.5% in October
Residential construction ramps up to meet steady demand.
Housing starts rose 25.5% in October to a seasonally adjusted annual rate of 1.323 million, the Commerce Department said Thursday, as multifamily housing starts came back with a vengeance. That was the highest pace since August 2007.
They added a “but” that hinted at what’s coming.
But economists questioned whether the construction uptick would be sustained over the longer term, citing the much smaller increase in permits, as well as an anticipated rise in mortgage rates that could dampen home buyer enthusiasm.
Of course, after that “dampening” of homebuyer enthusiasm that would cause a “correction,” the economists quoted by the Journal expected that all would be hunky dory again.
So, let’s take a look at this. Did starts actually rise at an annualized rate of 25.5% in October? What industry that you can think of grows at 25% per year? Look, even if they did have a strong month in October, the idea of extrapolating that on a straight line is nonsense. Nothing goes up in a straight line. Annualizing a single month simply multiplies by 12 the statistical error and any anomalies inherent in the market that month.
Let’s compare this with the actual, unadjusted data. It is surprisingly strong, but I think there’s an explanation. It is based on what I experienced as a commercial real estate appraiser.
Actual October total starts rose 21.2% from September, and were up 26.4% year to year. Wow. The unadjusted data was actually even stronger than the seasonally adjusted data. The seasonally adjusted data slightly understated the monthly and year to year gain. That happens, but in recent prior months just the opposite has occurred. The seasonally adjusted data overstated the strength of the trend in August and September.
I appraised residential construction projects for 15 years. Based on that experience, I suspect that builders were not rushing to start projects to meet all that “buyer enthusiasm.” Buyers are maxed out on their mortgage qualifying ratios. Rising rates will soon reduce demand at current prices, and builders know it. So maybe they were just rushing to get that first construction loan takedown where they can take out most of their developer’s fee and get it on the books before business goes south.
Builders see those rising mortgage rates as a runaway train coming at them. They want to get their profit out before it gets here. This is the kind of behavior that happens at the end of a boom, not the beginning and not the middle.
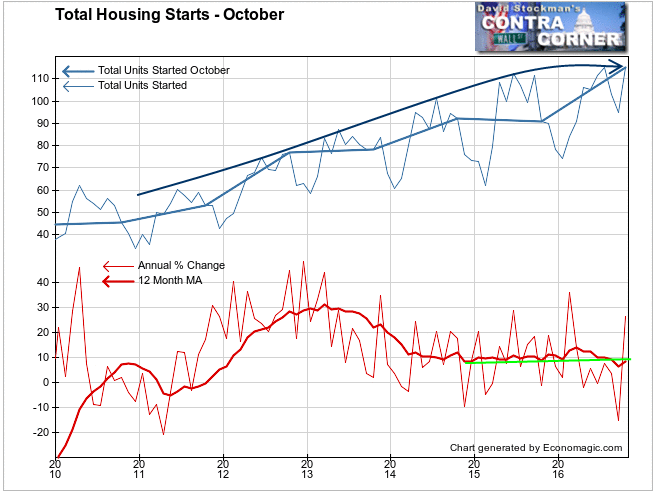
Here’s a chart starting from the bottom of the housing depression before it began to rebound in 2010. October is usually the peak of the year or a slightly lower peak than mid summer each year. Using those peaks, I drew the curve of the yearly highs in the current trend.
The trend is flattening as momentum has slowed over the past year. We won’t have a better idea if the curve I drew is correct until we see the strength of the spring rebound. The curve as drawn is my judgment based on the recent market action and my analytical opinion that mortgage rates have bottomed and are now trending higher. I see signs in my proprietary research that banking system problems in Europe are causing a shrinkage of cash in the world wide liquidity pool that is having a direct effect on the Treasury market.
Bond yields have been rising since July as European banks go into panic liquidation mode. Treasury yields have soared as European banks sold Treasuries to raise cash. Mortgage rates hadn’t moved yet as of October, compressing the spread between mortgage rates and the lender’s cost of funds, which is partly based on the 10 year Treasury yield. With the big spike in yields in the last 2 weeks following a steady rise since July, mortgage rates should now start moving up radically. That would choke off the market.
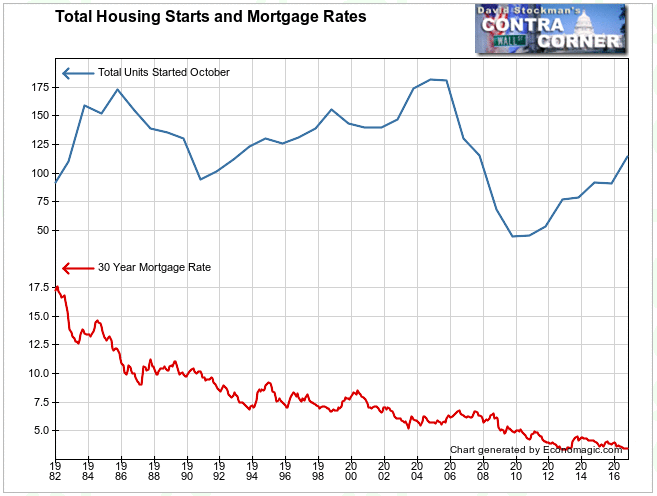
This chart shows the long term trend of starts and mortgage rates. Note that the recovery on the previous chart has only returned to 1993 levels. 6 years of growth has only brought the market back to half of its peak level in 2005. To get this far, mortgage rates had to be driven to an all time low of 3.44% this summer. In October they were still at 3.47%. As they climb toward 4% and beyond, house prices must fall in order for demand to be maintained. Otherwise, volume will collapse. Neither outcome is positive.
As far as that 26% year to year gain, it’s just a result of an extremely favorable year to year comparison in October. October 2015 was extremely weak, while this October had a huge pop. The result is a spike in the growth rate.
Using a rolling 3 month period tends to smooth out these random fluctuations. On that basis, the year to year change was just 3.6%. That’s teetering on the edge of a stall.
On a month to month basis, the change was +21.2%. That’s an extreme anomaly, and possibly an indication of a blowoff in supply as builders rushed to beat that train heading for them.
October is usually a flat to down month. Over the last 10 years, the number has been positive only 3 times. One time was this year and it was by far the largest gain. The second largest was in October 2007 with a 13% gain. That was in the early stage of the housing market collapse. Sales volume had already peaked in 2005 and 2006, and prices started down in the second half of 2007, around the same time as starts spiked.
So there are two ways to look at October’s apparent market strength. One is how Wall Street economists do it. They see the strong October number as a sign that the housing market is maybe a wee bit overbought, but healthy and sure to continue trending upward. I see it as a sign that the market is probably on the verge of getting a lot worse.
There’s a lot more interesting data in the housing starts report. Total starts can be misleading because this is really two different businesses— single family development for sale, and multi family development, which is overwhelmingly for rent. We’ll dive into those details in the days ahead.
Lee Adler first reported in 2002 that Fed actions were driving US stock prices. He has tracked and reported on that relationship for his subscribers ever since. Try Lee’s groundbreaking reports on the Fed and the forces that drive Macro Liquidity for 3 months risk free, with a full money back guarantee.

