
The Wall Street Journal and its fellow mainstream media industry PR people tried to explain away terrible housing starts numbers last week. The actual numbers are what they are, however. They don’t lie.
Total actual housing starts for the month, not seasonally finagled and not annualized, fell by 28% in November to a total of 82,800 units.
This number is subject to revision in future months as more complete data is accumulated. But it is neither seasonally adjusted nor annualized as the widely reported headline numbers are. Because the number is not seasonally manipulated, we need to compare it with past Novembers to be able to judge whether the number is good, bad, or so-so.
On that basis the number was unequivocally bad. The 28% drop from October was the worst since November 2008, when starts fell by 30% from October. That was in the middle of the post bubble collapse. The average drop for November over the past 10 years was -11%. November 2015 saw a drop of only 1%.
To smooth out any calendar effects which may occur in the month to month change, we can look at the 3 month total and compare that to past years. For the 3 months ended in November vs. the prior 3 months, total starts were down 20%. Again, this was the worst performance for this 3 month change versus the previous quarter, since 2008.
Meanwhile here’s how the housing industry PR people at the Wall Street Journal put it. This was in the news release by Jeff Sparshott.
U.S. housing starts tumbled in November but remained at a level suggesting steady demand for single-family homes amid low interest rates and steady job creation. [Emphasis mine]
Housing starts dropped 18.7% in November to a seasonally adjusted annual rate of 1.090 million, the Commerce Department said Friday.
…Economists surveyed by The Wall Street Journal had expected November starts to fall to 1.23 million…
We have to ask them, why not just report the facts, instead of giving them a positive spin? Notice how they glossed over the bad news, which even the seasonal adjustment process couldn’t hide. But Sparshott took it a step farther, excusing the weakness because of a strong October.
…The drop-off follows an especially strong October, which registered the highest number of overall starts since July 2007.
That excuse doesn’t wash. It ignores that the 3 month September-November total also fell off a cliff from the 3 previous months. It was a far worse than normal performance. The Journal managed to even exclude that from consideration, focusing instead on single family starts. Spinmeister Sparshott spun (repeat 3 times quickly),
November’s three-month moving average of single-family starts, which smooths out some of the monthly volatility, registered at the highest level since the end of 2007.
The fact is that November total starts were down nearly 8% year to year. The 3 month September-November period rose to a total of 293,500 units (actual not seasonally adjusted) from 292,400, a year to year gain of 0.4%. That’s not even a rounding error, and was only achieved by the anomalous October. October was way out of whack compared to the usual October behavior.

That chart only shows what has happened since the rebound from the housing crash began. That’s typically all the Wall Street media shows you. The past may be prologue, but not to the Wall Street media crowd.
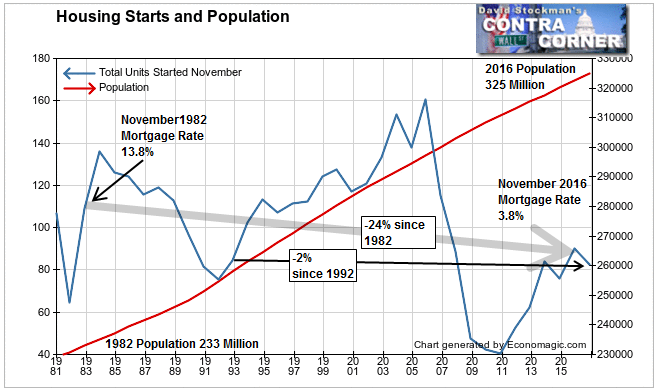
So let’s keep this “recovery” in perspective. The November total of 82,800 starts compares favorably with… drum roll please… November, 1992. The US had 67 million fewer people then than it does today. Population has increased 26%. Starts have increased… oops, they haven’t increased. They’re down 2% compared to November 1992.
How pathetic is that? In November 1992 the 30 year fixed mortgage rate was 8.3% versus 3.8% today.
Even more pathetic, going back another decade to November 1982, the mortgage rate was 13.8% and sales totaled 109,000 units. Population is up by 40% since 1982. Mortgage rates are down by 72%! But the current level of starts is down 24% versus 1982!
And they talk about “recovery.”
We can adjust for population growth by dividing starts by population and converting that to starts per million population for ease of comparison. I have also broken that out by multi and single family starts to see where the problem lies. Is it in both sectors or just one or the other?
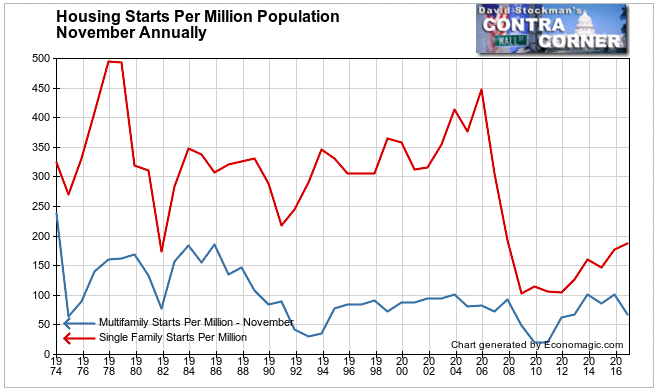
The greater problem is in multifamily housing. It peaked last year and has collapsed. Whereas multifamily starts were running at a rate of around 185 units per million of population in the mid 1980s, that rate never exceeded 100 units during the housing bubble. It recovered to that level in 2013 and 2015, but has subsequently dropped back to 67, which is the same level as in 2012.
In the immortal words of erstwhile New York gubernatorial candidate Jimmy McMillan, “The rent [really] is too damn high.” What does it say about an economy where new rental unit construction falls off a cliff in the face of record numbers of new jobs? Apparently those jobs can’t even pay the rent.
Meanwhile, single family starts per million population continue to “surge” off the 2011 low. It has been 7 years after the housing crash bottomed, and we have had 5 years of recovery. Yet starts haven’t even reached the level reached at the bottom of the 1991 recession.
I’ll take a deeper look at the data for the two different housing industries in a future post. We’ll look at what the data tells us about for the future of the housing business, the economy and the financial markets. I’ll tell you why the gain in single family starts is a last hurrah. And I will tell you why the drop in multifamily starts is a bad omen in a world where central bankers aim to rig the economy by rigging the financial markets.
Lee first reported in 2002 that Fed actions were driving US stock prices. He has tracked and reported on that relationship for his subscribers ever since. Try Lee’s groundbreaking reports on the Fed and the Monetary forces that drive market trends for 3 months risk free, with a full money back guarantee. Be in the know. Subscribe now, risk free!

