
“U.S. Industrial Production Up 0.1% on Better Factory Output,” proclaimed the Wall Street Journal on Tuesday. “Struggling manufacturers may be finding their footing in the second half of the year.”
The monthly industrial production indexes contain a wealth of information about the performance of the US economy. They represent the production of factories, mines, and utilities in unit volume, not dollar sales, including totals, and figures by industry. While they do not represent service industries directly, they do so indirectly because industrial production feeds service business and vice versa. The IP indexes give us a pretty good idea of how the US economy is performing overall and by industry.
There are a number of ways to look at the data. Some are helpful. Some are useless, such as the Wall Street Journal’s reporting, which continued,
U.S. industrial output improved slightly in September, suggesting struggling manufacturers and oil producers may be finding their footing in the second half of the year.
Industrial production—a measure of output at factories, mines and utilities—rose a seasonally adjusted 0.1% in September from August, the Federal Reserve said Monday. Overall manufacturing output, which accounts for more than three-quarters of all industrial production, rose 0.2% last month.
As always the headlines are reported on the basis of a fictional representation of reality known as the seasonally adjusted monthly change. The purpose of seasonal adjustment is to give us “little people” who have no experience with “economics” an abstract impression of the trend. The actual data is supposedly too noisy for us to see the trend. Since economists, government statisticians, and financial news repeaters aren’t technical analysts, I guess they never heard of trendlines, or of examining the path of actual year to year changes. Those techniques require no statistical massage to present an accurate picture.
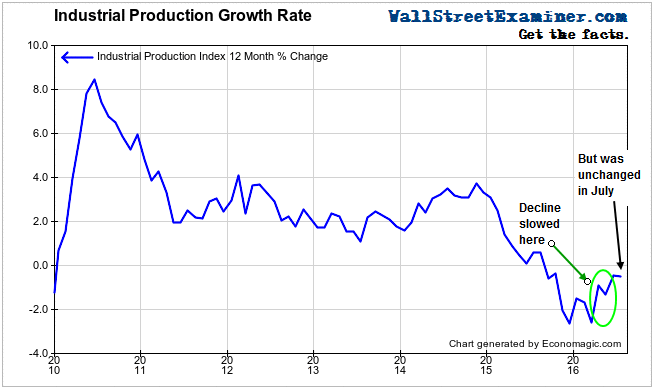
The problem is that on an unadjusted basis, that is, actual production as opposed to a statistical abstraction, we can see that there has been no improvement at all. In fact, the rate of change (we can’t call it a “growth rate at this point) has been fluctuating in negative territory for the past year. It is true that the rate of decline did slow in September, but it is no better than it was a year ago. The only question is whether the contraction is slower or faster. Right now it’s not as bad as in the first half, but it’s still contracting and it is still below the high water mark of the past year set during the summer.

Click here to view chart if reading in email.
Growth began to slow in December 2014, going negative in September 2015. The year to year decline reached -2.6% in both December 2015 and March of this year. It was at that point that the downward momentum stopped, with the year to year decline improving to -0.45% in June. In July, the annual rate of change slipped to -0.7%. The decline was -0.6% in September, hardly an improvement.

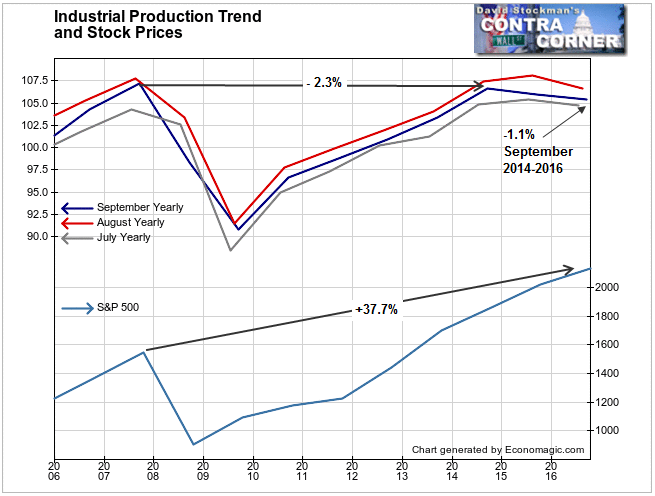
Looking at the long term trend, here’s another interesting tidbit. The level of the index in September was down 1.1% from its peak in 2014, and the 2014 peak was down 2.3% from the 2007 high when IP was peaking a year after after the housing bubble had peaked. At the same time, the S&P 500 is 37.7%% higher. Meanwhile The Street would have you believe that this isn’t a bubble!
Therein lies the kingdom, the power, and the vainglorious uselessness of central bank market rigging. It works for the bankers and speculators. It doesn’t work for the US economy. A case can be made that by discouraging savings and distorting investment returns, QE and ZIRP actually retard economic growth.
Notably, as IP has stalled over the past year, stock prices have continued to rise. Even though the Fed ended its QE program, it has kept interest rates near zero. At the same time the 2 headed monster of the BoJ and ECB have actually increased their QE programs and deepened their negative interest rates. In this interconnected world of finance dominated by multinational megabank trading firms, QE anywhere is QE everywhere. So US stocks have continued to inflate while the US economy languishes.
The industrial production data includes breakdowns by industry and sector which can tell us a great deal more about the state of the US economy. It’s worse than the headline writers would have you believe. We’ll illustrate some of that data for you in the days ahead.
Lee Adler first reported in 2002 that Fed actions were driving US stock prices. He has tracked and reported on that relationship for his subscribers ever since. Try Lee’s groundbreaking reports on the Fed and the forces that drive Macro Liquidity for 3 months risk free, with a full money back guarantee.

