
Usually when the mainstream media reports economic data, they like to put a positive spin on it. But when the Wall Street Journal reported US industrial production last week, it hedged.
The headline was bullish.
U.S. Industrial Production Rose 0.5% in March
Capacity use, a measure of slack in the economy, rose 0.4 percentage point to 76.1%
But the lead-in had an important caveat. Apparently the gain was because March was colder than usual in much of the country. That triggered a big uptick in utilities production.
U.S. industrial production rose in March as the weather cooled and demand for home heating surged, masking a drop in manufacturing activity during the month.
Industrial production—a measure of output at factories, mines and utilities—climbed 0.5% from a month earlier, the Federal Reserve said Tuesday. Economists surveyed by The Wall Street Journal had expected the index to climb 0.5%. Output for February gained 0.1%….
The more important nugget, which should have been the headline, was that factory production fell. But that would not have been quite true, as I’ll show momentarily.
The mainstream media limits its reports on economic data to the a seasonally adjusted (SA) impression of actual activity. Statisticians use statistical sleight of hand in an attempt to extract the trend from the actual data. Often the resulting number misses the mark. Sometimes it misrepresents the trend completely. Government statisticians subsequently revise the number for the current period over ensuing months and years to fit the seasonally adjusted data for this period to the curve of the actual data.
As a technician, I like to see the actual data. I put it on a graph and draw a few straight lines and momentum indicators to find out exactly what happened, and to clearly view the trend.
The actual, not seasonally adjusted (NSA) data for the Total Index showed a rise of 1.5% for March and 2.1% year to year. In order to judge how strong or weak March was it must be compared to the same month in past years. On that score, the performance of the total index was strong. Over the past 10 years March has averaged a month to month increase of +0.5%. In March of 2016, the month had a drop of 0.5%. We’ll look at whether that was entirely due to the weather in a moment.
On a year to year basis, the gain of 2.1% the strongest year to year performance since January 2015. However, total production remained below the 2015 peak. It was only fractionally higher than the 2008 peak. So over the past 9 years, IP has fluctuated, but it hasn’t grown. This is in spite of the fact that the US has about 7% more people today than in 2008.
Growth has now turned positive after a couple of years of decline. Flying in the face of conventional wisdom, the Fed has raised interest rates, and growth has accelerated. This always happens when the Fed raises rates. Consumers and businesses go into panic buying mode. Rates don’t bite until they become truly punitive.
Keep this in mind as the Fed flails helplessly to slow rising inflation and bubbles that refuse to deflate. Don’t be surprised if the top line economic numbers strengthen in the early stages of a rate increase cycle. Most importantly, remember that financial markets top out when the news is good. The bond market normally leads the way down. Stocks follow. It is a huge mistake to be lulled into bullish complacency just because the economic numbers are positive.
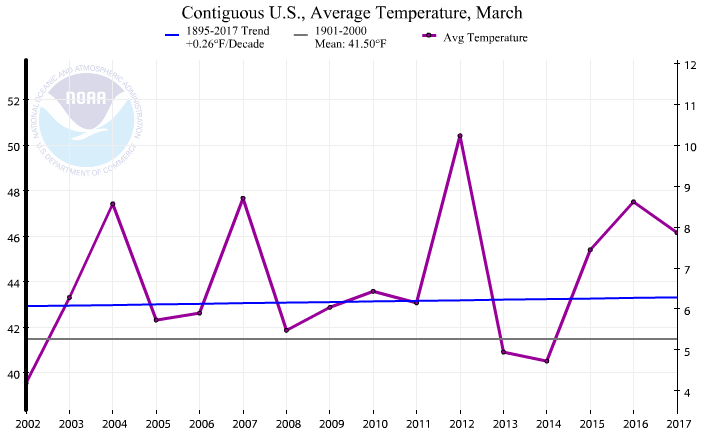
The Journal said that the increase was entirely due to a rise in utilities production as a result of colder than normal weather in March. March is indeed a swing month where unusual weather can have a big impact on Utilities production. That in turn can add or shave a few tenths of a point to or from the total index. We obviously use more heat when weather is colder than normal and less when it’s warmer. But in fact, March was not colder than normal. It was down from March 2016, but was well above normal. It was in the upper half of the range of the past 15 years.
In short, nationwide weather does not appear to be the reason for the reported increased utilities production. But surge it did, rising 2 points in March and 6.1% year over year. Electric and Gas Utilities represent about 11% of total industrial production. The 6% gain in this sector was sufficient to swing total industrial production from flat to positive.
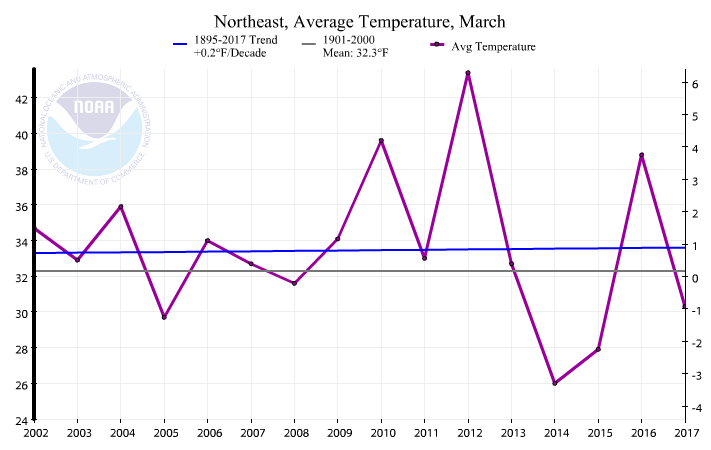
The March increase in utilities production was a real outlier. Over the past 10 years, March was always a down month for Utilities. Since the weather nationwide was not the culprit, we can only guess that the weather in the Northeast and Midwest was solely responsible for the rise in utilities production. In fact, the weather was much colder this March than March 2016 in the Northeast, and it was, in fact, below the historical average. So this time, it is apparently fair to blame the weather.
Separating the energy and non energy industrial components we can clearly see the impact of Utilities. Non Energy Industrial Production rose by 1.5 points in March on a month to month basis. That is indeed a weak performance. The 10 year average March gain was 1.9 points. This year’s March performance was slightly better than March 2016’s, but it was the second worst March since the recovery began in 2009. On a year to year basis, production rose by 1.3%. That’s slightly better than it has been since January of 2015, but it still leaves total production just a half percent above the 2015 peak and still 5.6% below the 2007 peak.
The bottom line is that the US is producing less than it was in 2007. The stock market gains relative to that peak are not supported by any gains in US industrial production, weather or not.
Lee first reported in 2002 that Fed actions were driving US stock prices. The US Treasury has also played a role in directly moving markets. Lee has tracked and reported on those relationships for his subscribers for the last 15 years, helping to identify major turning points in the markets in their earliest stages. Try Lee’s groundbreaking reports on the Fed and the Monetary forces that drive market trends for 3 months risk free, with a full money back guarantee. Be in the know. Subscribe now, risk free!

