
Ben Bernanke first set an official inflation target in January 2012, aiming at 2%. Since then the Fed has claimed that it would begin to normalize interest rates when the target was reached and unemployment fell below 5%. The latter goal has long been met, but what about the inflation target? Well, it depends on how you measure inflation. And I’m not talking about private measures that actually reflect reality like David Stockman’s Flyover CPI. I’m talking about official measures.
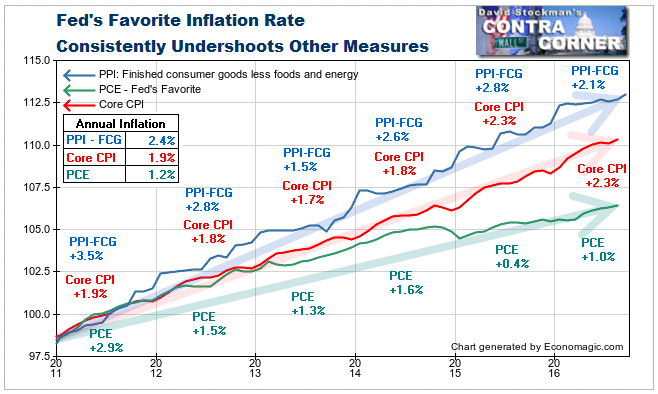
There are many to choose from. Lo and behold, surprise surprise, the Fed has chosen the one that is most suppressed and furthest from the experience of most American households. That is the PCE, which has gone up by just 1% over the past year and has averaged. 1.2% over the past 5 years. So the Fed can pretend that inflation is “too low,” whatever that means.
My favorite official measure of inflation, which the mainstream media never reports, is the Producer Price Index for Finished Consumer Goods ex food and energy. It represents the price changes that retailers pay for their finished goods inventory. It has persistently outrun the widely followed CPI and the Fed’s favorite, the PCE, by a wide margin ever since inflation began to rebound from the pits of the recession in 2009. With the PPI indexes released Friday, we now know that the Core PPI for finished consumer goods has risen by 2.1% over the past year. That is slower than the prior 12 months, when that measure inflated by 2.8%. Meanwhile this measure has averaged a 2.4% increase over the past 5 years.
For either the CPI or PCE to be believable in light of this data, it would be necessary to believe that retailers never pass along their persistently increasing costs to consumers. Meanwhile, the official measures of consumption goods and services inflation consistently understate actual inflation. They do not measure housing cost accurately, substituting a measure called Owner’s Equivalent rent for the actual price of housing and for market rents. These have been growing at 5% plus per year over the past couple of years. Yet the BLS has been imputing OER at 2.5% to 3%.
OER and related measures account for about 40% of Core CPI and around 32% of total CPI. By using OER instead of actual house prices or rents, the BLS and BEA are able to shave anywhere from a half point to to a full point off the CPI and PCE. The BEA uses a variety of statistical tricks to suppress PCE even more than the BLS uses on CPI.
Meanwhile the fall in energy prices in 2014 caused a big dip in total CPI, but the Core measure just kept trundling higher. It has been above the Fed’s target for the past 2 years while the Fed’s favorite, the PCE, stumbled along at less than half that over the past 2 years, and an average of 1.2% since 2011.
The PPI for finished core consumer goods suffers from no such manipulation. However, it is not a perfect indicator of overall inflation since it includes only finished goods, and does not include either housing or services. Education and medical services, both of which seem to be almost constantly hyperinflating, are not included. But the PPI for finished consumer goods is a far more realistic representation of actual inflation than CPI.
So where has all the Fed printed money gone? What kind of inflation has ZIRP stimulated? The answer is simple: asset inflation. But economists don’t count that. It’s crazy; anything that isn’t what they call a consumption good, simply doesn’t count. It’s not inflation. When asset prices rise, they call it “appreciation,” when it’s really a direct result of monetary inflation.
When the Fed sets an inflation target, it has nothing to do with monetary inflation, which in classical economics is a sustained increase in the money supply. We have certainly had that. Since 2011, just before Ben Bernanke decided that we needed an inflation target of 2% in January 2012, until now, M2 has grown by a compound annual rate of 7.1%. That obviously exceeds the Fed’s target. But it doesn’t count. So the Fed has an excuse to keep printing money or to keep interest rates at zero.
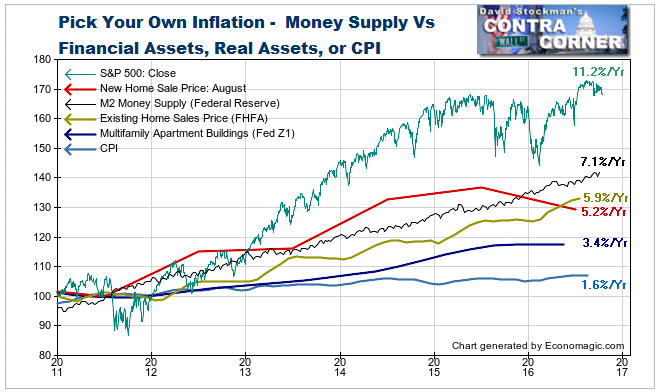
Meanwhile, headline CPI has grown at only 1.6% per year because the BLS under measures it with the OER and other gambits. When housing is included in CPI at the correct rate, consumption inflation is around 2.5% to 3%. Yes, that’s above the Fed’s target, but the Fed doesn’t see it, and it’s still less than the rate of monetary inflation.
So what happens when we continue to get 7% monetary inflation when the US economy only grows at 1.5% to 2.5%? We get asset inflation. The Fed says that multifamily apartments, the quintessential real property investment asset have been inflating at 3.4% per year. That’s another piece of Fed BS. Freddie Mac said at the end of 2015 that multifamily properties had increased in value by 13-15% per year from 2009 to 2015. Harvard’s Joint Center For Housing Studies said that multifamily investment properties had “appreciated” by 40% in the 5 years through 2015. So who knows? One thing seems certain, like everything else the Fed measures inflation wise, its numbers are obviously too low.
In the single family home market the Federal Housing Finance Agency (FHFA) says that prices are rising by 5.9% per year. FHFA uses an extremely conservative measurement method similar to Case Shiller’s where older homes are overweighted. The NAR’s unmassaged home price index shows prices up by 7% per year since 2011 exactly the same as the monetary inflation rate. Meanwhile the Census Bureau says that new home sale prices have risen by 5.2% per year, and that’s after a big slump over the past year that suggests that the housing market is weakening.
Is the bloom off that rose? Is the Fed threatening to cause a mortgage rates to rise just when the housing market is beginning to show signs of weakness? It would not surprise any of us if the Fed has blundered yet again. Its timing has been atrocious ever since Greenspan took over after Volcker. This is likely to be just another massive blunder in its history of long term serial strategic blunders. Yes, rates need to rise if we are ever to return to a healthy economy with rational interest rates leading to rational investment returns and rational decision making, but the Fed waited far too long. It has left no escape route that doesn’t involve massive pain. It’s way too late for a soft landing.
So the Fed focuses on consumption inflation, using suppression measures to massively understate PCE. At the same time, consumption inflation is rising faster than the official measures say, putting the squeeze on US households. Consumption inflation has actually more than offset wage increases that have averaged 1.5-2.5% since 2011. If consumers aren’t earning more, they can’t drive consumption goods inflation higher because they just don’t have the money. Bankers and speculators have it, and they have made sure not to share any of it with workers scraping to get by.
If wages aren’t rising, there’s no way for consumer prices to rise, not matter how much the Fed prints and no matter how long it keeps interest rates at zero. There’s an oversupply of labor, and businesses are reducing the need for labor by automating every workplace task imaginable. This is nothing new. Automation has been around forever. Unions collapsed years ago. Globalization has forced wages down.
All these processes are structural. There will be no end to them. Aggressively easy monetary policy will NEVER stimulate wage growth or consumer inflation. Every major central bank has tried this, in Japan’s case for decades, and it has never worked. It never will. Yet just today Janet Yellen threatened to do more of that which has proven not to work. It’s insane.
What we do get from all the easy money is asset inflation. That has put a patina of stability and good times on what is a dangerously unstable situation. A loss of confidence is brewing, and once it gets rolling it won’t be long until the margin man comes a knockin and asset prices collapse in a wave of liquidation and deleveraging that will be required to raise cash to pay off all the debt. Once that starts, there won’t be enough cash to meet those obligations, because margin calls will destroy it faster than it can be raised. Massive fire-sales of assets will lead to a deflationary collapse.
What will the Fed do then? Buy everything? Don’t bet against it. But it will be too late.
Lee Adler first reported in 2002 that Fed actions were driving US stock prices. He has tracked and reported on that relationship for his subscribers ever since. Try Lee’s groundbreaking reports on the Fed and the forces that drive Macro Liquidity for 3 months risk free, with a full money back guarantee.

