
The Wall Street Journal led yesterday’s report on Consumer Prices with a typically hysterical headline.
U.S. Inflation Gauge Tops 2%, Supporting Fed’s Plan to Raise Rates
Consumer-price index increased 2.1% in December, the largest rise since June 2014
The Wall Street Journal and all of the mainstream media and Wall Street pundits act as if reaching 2% is something new. They imply that now that we’ve gotten to that level, the Fed will be encouraged to raise interest rates to fight “inflation.” Not that ever worked, or that going from zero interest rate to 1% now would work, but that’s an issue for another day.
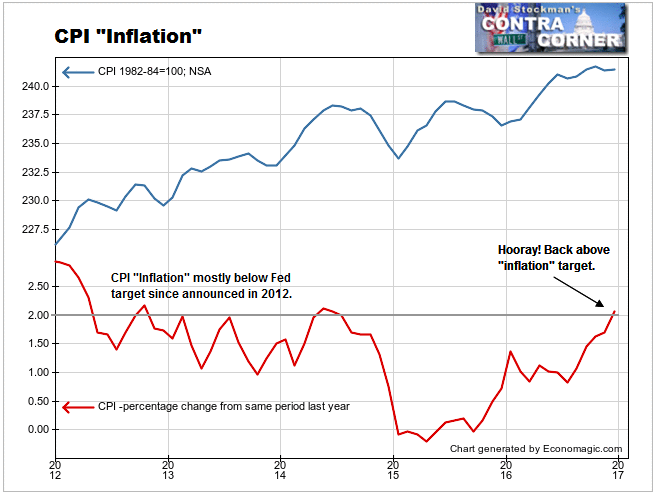
“A broad measure of inflation poked above 2% for the first time in 2½ years, a sign of diminished slack in the economy that could support additional moves by the Federal Reserve to lift interest rates this year” said the Journal. The Journal was referring to the Fed’s 2% “inflation” target. In fact the Fed, BLS, and the economics priesthood had not been measuring inflation at all. Had they been doing so 2% would have been the floor, not the target. The Fed set that target in 2012. And most measures of “inflation” have been well above 2% ever since then.
It’s true that CPI is a broad measure of the prices of consumer goods. But is that “inflation?” CPI’s methodology massively suppresses the rapidly rising cost of housing. It underweights the impact of skyrocketing health care costs. And while fuel costs pulled headline CPI down in 2014-15, Core CPI, which excludes food and energy marched steadily higher. It surpassed 2% in November 2015. Meanwhile, the Fed’s favorite measure, Core PCE languishes around 1.6%.
The Journal went on to say in its report, “The Fed’s target is a 2% annual inflation rate, though its preferred gauge is the Commerce Department’s personal-consumption expenditures price index and not the Consumer Price Index. As measured by the PCE index, U.S. inflation was a modest 1.4% in November.”
No wonder everyone thinks there has been no inflation.
David Stockman developed the Flyover CPI as a more accurate measure of consumer price inflation as it affects the majority of Americans who don’t live in America’s glitz capitals on the East and West Coasts. By counting housing inflation accurately, and giving a bit more weight to energy and healthcare, we get a clearer picture of inflation as it applies to most US households.
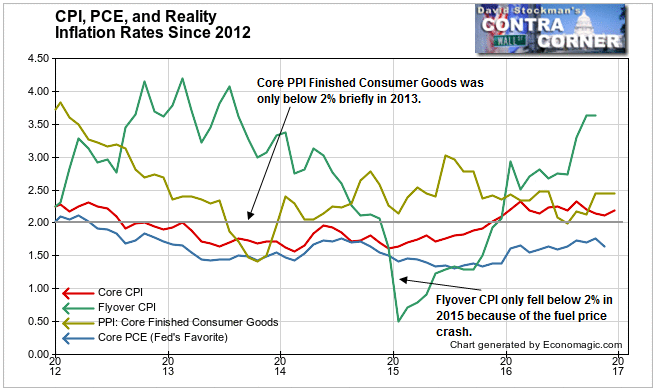
In recent months energy costs have gotten traction and are rising again. But in 2014 and 2015, crashing energy costs pulled the Flyover CPI below 2% for about a year. Other than that, it was always well above 2% from 2012 to late 2014. It rose back above 2% in December 2015. It is now running around 3.6%.
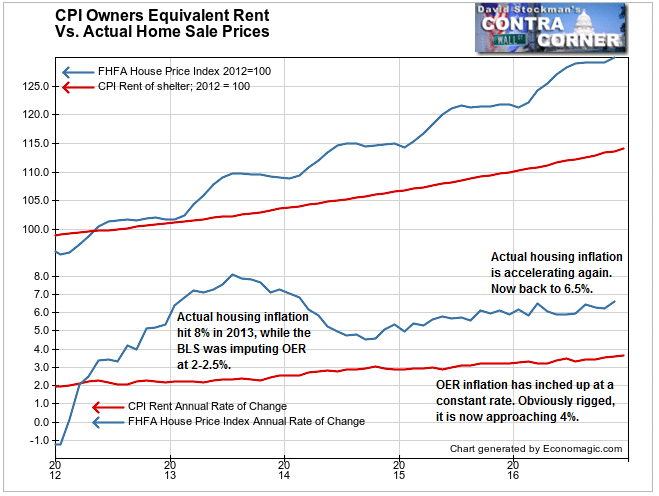
CPI massively understates housing cost inflation via the use of a substitute measure called Owner’s Equivalent Rent (OER).We have covered the methodology behind that measure in some detail in previous posts. OER cuts housing inflation by 3-5%. That component consists of about 41% of Core CPI and 32% of headline CPI. As a result it cuts reported CPI by a total of about 1%. The Flyover CPI substitutes actual median US house prices for the OER measure. It also slightly increases the weight of energy costs and punishing health care cost increases for the typical middle income family.
The Fed, the Street, and mainstream economists all like to pretend that CPI measures inflation. That measure and the Fed’s favorite inflation measure, Core PCE (Personal Consumption Expenditures), have languished below 2%. This allowed the pundits to constantly intone their mantra, “Yes, we have no inflation, we have no inflation today.” When I see that, it’s always to the tune of Yes, We Have No Bananas. That’s how ridiculous it is.
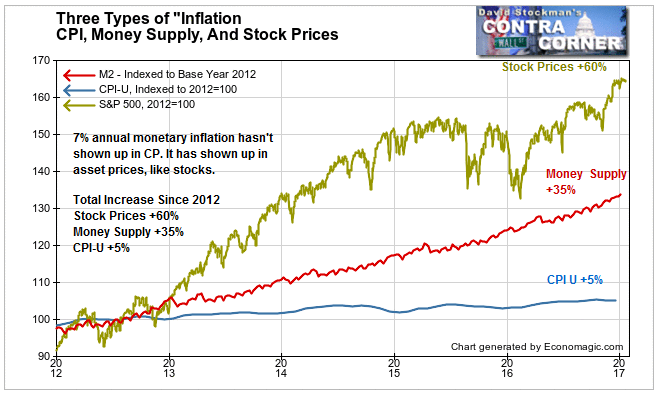
Milton Friedman, the father of Monetarism, said, “Inflation is always and everywhere a monetary phenomenon in the sense that it is and can be produced only by a more rapid increase in the quantity of money than in output.” Economists define inflation as “a sustained increase in the general price level of goods and services in an economy over a period of time.” That means they limit the definition of inflation to consumer good and services only. Asset prices are excluded by definition.
So here we are with central bank money printing causing broad money, M2, to soar by 7% per year, year in and year out since 2010. Yet CPI is only 2.1% and PCE is only 1.4%. Money supply growth has been far in excess of what the economy could use in its embedded growth rate of around 2-2.5%. Why isn’t inflation 4% to 4.5%? The answer is that it is. In fact it’s well above that in some areas. But the economics professors’ definition of inflation excludes asset prices. So where radical and rapid inflation is occurring, it is invisible to the economics priesthood, to Wall Street, and to the clueless mainstream media and pundit community.
CPI should start to catch up with the more accurate consumer price measures as OER continues to rise as it lags home prices. The headlines are correct that this should encourage the Fed to raise rates. That’s not bullish. I would be out of most if not all long positions at the first technical signs that the stock market is beginning to crack.
Lee Adler first reported in 2002 that Fed actions were driving US stock prices. He has tracked and reported on that relationship for his subscribers ever since. Try Lee’s groundbreaking reports on the Fed and the Monetary forces that drive market trends for 3 months risk free, with a full money back guarantee. Be in the know. Subscribe now, risk free!

