A 2 year string of record lows in initial unemployment claims finally appears to be ending. First time claims in the September 5 week were not materially lower than last year, and were actually slightly above the first week in the record setting string which began in September 2013. From then until now almost every week saw a new record low for the comparable week of the year as claims continually plunged by 5-15%. That trend has now turned flat. A similar pattern developed in 2006-07. The housing bubble had already peaked but it took employers months to figure it out. At that time it took stock investors even longer. This time around some investors appear to have already gotten the message.
The stock market has recently broken as initial claims have flattened. This is how it has historically worked as bubbles start to deflate. Employers usually seem to be the last to get the news. But the very fact of their record long term ebullience was warning enough, as chronicled here in these reports over the past year. Until last week, employers hadn’t wisened up, but suddenly now it appears that some of them have also gotten the message. Things are likely to get much worse as the real job cuts come and hit deep.
Actual initial unemployment claims counted by the 50 states totaled 231,972 last week beating this week of last year by a smidgen. But this time it wasn’t enough to break the low set at the beginning of a nearly uninterrupted string of record lows that began in September 2013. That record stands.
The Department of Labor (DoL) reports the unmanipulated numbers that state unemployment offices actually count and report each week. This week it said, “The advance number of actual initial claims under state programs, unadjusted, totaled 231,972 in the week ending September 5, an increase of 1,893 (or 0.8 percent) from the previous week. The seasonal factors had expected an increase of 7,594 (or 3.3 percent) from the previous week. There were 234,755 initial claims in the comparable week in 2014.”
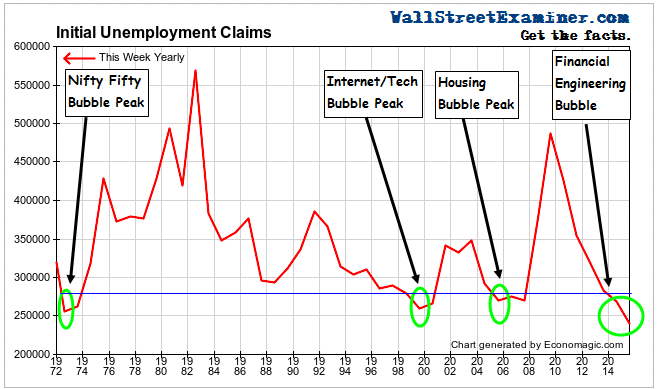
Below is a 10 year chart of the actual data illustrating the flattening of the trend over the past 2 Septembers.

Click here to view chart if viewing in email
We use actual data, as opposed to the seasonally finagled headline numbers which Big Media shovels out for mass consumption. We want to see from the actual numbers if there’s any evidence of trend change. So we look at how the current week compares with this week in prior years and whether there’s any sign of change in the trend. The actual change for the current week versus the prior week was an increase of 1,900 (rounded). This week of September is a swing week, sometimes with an increase in claims and sometimes with a decrease. There’s no basis for a seasonal adjustment, but that doesn’t stop the DoL from applying one.
The 10 year average for actual data for the week was a decrease of +4,600. This year was slightly worse than that average but it was much worse than 2014 which had a decline of -15,000. And it was far worse than 2013 which had a drop of -39,711 in setting the first record low in the string that lasted 2 years.
Week to week changes are noisy. The trend is the thing we must watch. In that vein, the annual rate of decline in claims slowed significantly this week. Actual claims were 1.1% lower than the same week a year ago. Since 2010 the annual change rate each week has mostly fluctuated between -5% and -15%. This week’s data was outside the normal range. One week does not a trend make, but this is the second straight year that the number did not exceed the September 2013 record low. In addition, the annual rate of of decline has been steadily moving toward zero since April. That commands that we pay attention.
A shift to a year to year increase in claims would be a sign that the US economy could be headed for recession. The stock market is a key. As it weakens, employers will take their cues from that. The Fed knows that businesspeople watch the stock market and often base hiring and firing decisions on its direction. A weakening market will make the Fed even more cautious to make significant changes in policy. The Fed may give lip service to raising rates, but without actually reducing the amount of excess cash in the banking system, it will be little more than a really futile and stupid gesture on the Fed’s part, as shown in this clip on how the Fed will make its decision next week.

Click here to view chart if viewing in email
Real time withholding tax data is consistent with the claims data. It was very strong earlier in August but began to tumble late in the month and early in September. That may be part of the normal short term cycle in collections or it could be something more serious. It’s too soon to tell for sure. We will continue to track this in the weekly Wall Street Examiner Pro Trader- Federal Revenues report.
Below is a review of the implications of the extreme readings on initial claims from a post n August 13, 2015.
“However, it is absolutely normal for employers to completely miss the signs of impending doom.
“In recent weeks, Big Media and others have noted the fact that claims were recently lower than the record low of 1973. What they failed to mention was that that low came well after the Dow reached an all time high in January of that year. The devastating 1973-74 bear market, which cut the value of stocks by 50%, was in its early stages. This was an early example of employers being late to the funeral.
“Similar employer hoarding of workers has been associated with bubbles in the more recent past and has led to massive retrenchment, usually within 18 months or so. In the housing bubble, employer hoarding behavior continued well beyond the peak of that bubble in 2005-06.
“It’s worth noting that there was an institutional stock market bubble in 1972-73. It was the Nifty Fifty bubble, where the biggest best known stocks kept soaring while everything else in the market went nowhere. A bubble does not require mass public participation. Institutional bubbles are just as insidious, even more so.
“The current string of record lows in claims is now 6 months beyond the point at which other major bubbles have begun to deflate. Based on the fact that previous records were attained at and for some time after the peaks of massive bubbles, by that standard, the current financial engineering, central bank bubble finance bubble, which is very much a big money, institutional bubble, may be the bubble to end all bubbles!
Click here to view chart if viewing in email
“As a result of the fact that employers apparently tend to take their cues from stock prices, we cannot depend on the next downturn in the claims data to give us advance warning of a decline in stock prices, although there should at least be concurrent confirmation. However, history shows that the fact that claims are at record lows is warning enough! In this case, the warning has lasted far longer than ever before.