
The speculative fervor in China’s equity markets is spreading as the Shanghai Composite hits new multi-year highs on elevated volume. The index easily cleared the 5000 mark after hovering just just above 2000 around six months ago. This rally has been nothing short of spectacular.
 |
| Source: Investing.com |
Here are some key trends that point to just how heated the market has become.
1. A-share (domestic) trading activity has exploded.
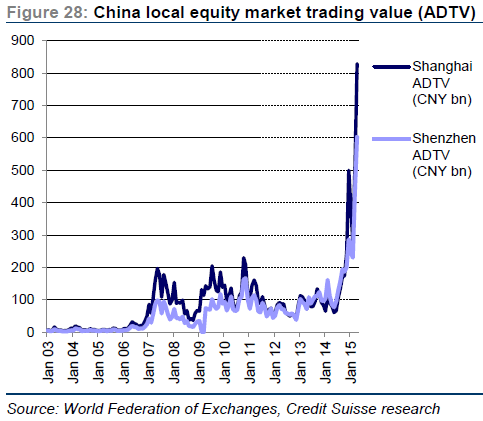 |
| Source: Credit Suisse |
2. Weekly account openings have reached new highs. This is a revenue bonanza for China’s brokers as many tap the IPO market for themselves (see story).
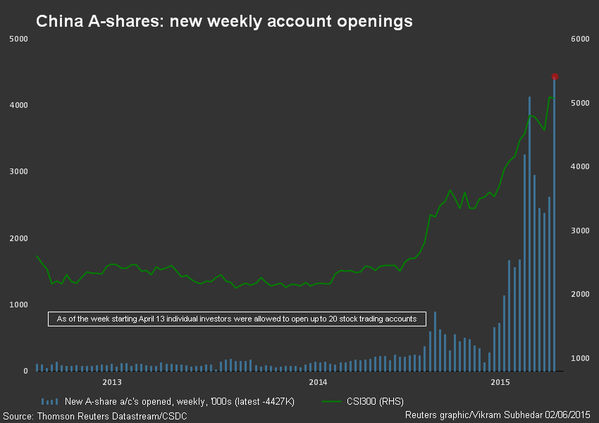 |
| Source: @vikramreuters |
3. P/E ratios are touching historical records as well as valuations are stretched in many instances.
 |
| Source: @NickatFP |
4. Margin debt levels are also near record, including as a percentage of market capitalization. Here is margin debt a percentage of the GDP.
 |
| Source: @PatrickMcGee_ |
Perhaps the most telling sign of speculative activity is this photo. There isn’t much one could say here.
 |
| Source: @enlundm @DoubleEagle49 |
China’s public equities market cap is now around $10 trillion (as a comparison, Japan’s whole market is half that). That’s over 13% of the global equity market capitalization (after being just above 5% some six months ago). Chinese tech firms listed in the US are now running back to China where their shares can get an instant pop in valuations (see story).
While many analysts are calling this a bubble, it’s important to point out that bubbles can last for a long time. Unless Beijing interferes – and there is a strong possibility it will – this trend could last for a while. Of course the longer this goes on, the uglier things will get on the way down.
Source: Sober Look: Unprecedented levels of activity in China’s equity markets

