
GDP as an econometric measure is designed to be most favorable toward growth. It accumulates all forms of spending, in dollar terms, treating them exactly the same regardless of source or destination. That is consistent with orthodox theory which holds onto the concept of “aggregate demand”, meaning that all demand is supposedly interchangeable. Thus whatever the source or reason for activity taking place, the very fact that activity takes place creates an addition.
Intuitively, that may make some sense but only if you stop at the very beginning of economic processes. An economic system is not the accumulation of activity, but the broad-based system of exchange and productivity (true capitalism) that leads to labor specialization; you don’t have to grow your own food or make your own clothing, you can instead trade your own labor at your own desire. In most cases, the accumulation of activity corresponds with rising labor specialization which is why GDP seems relevant.
It would make sense, however, in cases where “demand” is lacking that the theory of “aggregate demand” and its measure in GDP might break down. For example, if there were suddenly an increase in demand for the circus, that increase in spending on it would lead to a higher GDP value. And even though entertainment spending is not the most economically productive mode of circulation, if the increase in spending were sufficient to cause additional hiring or the creation of new and larger facilities (capex-based hiring) then it is useful toward the primary economic objective.
If, however, the circus because of the increase in attendance, is forced by the government to radically up its insurance outlays, eradicating much of the new profit potential, that would lead further economic circulation outside of the circus and toward the insurance company. If the insurance company had to hire new underwriters and investigators to service the new policies and limits, then this redistribution on net is similar enough to also be economically useful. There is, though, a major difference in that demand for labor shifts from entertainers (a particular specialty) to demand for finance types (another specialty). So redistribution is not neutral and should be taken into account at least qualitatively.
But in reality, the insurance company hiring is not going to be the same as the circus hiring since the new policies are likely to flow instead to the insurance company’s bottom line (which is why they are predisposed to lobby government so heavily). There may be a few new hires, but nothing on the level of what the circus might have done with the same amount of profit. In this case, economic circulation from increased “demand” for the circus now flows into an insurance company’s profits which are either reinvested in an asset “market” or distributed to the owners. The economic channel in this manner is much less efficient toward actual economic gains, i.e., true wealth and labor utilization.
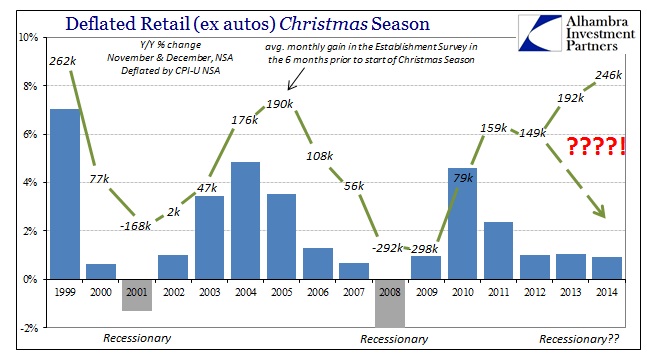
The introduction of the health insurance mandate seems to have taken similar effects on consumer activity in the past few years. And here again GDP makes no distinction between spending on health insurance (where no such spending existed before or did so at a much lower level; for a significant marginal spectrum) and spending on anything else. That is why GDP can be divorced from other means of spending, such as retail sales.
In the past three quarters, PCE Service spending on health care has averaged a half percent contribution to GDP; from 2010 until the middle of 2013 (when health care ramped up) the average contribution was less than half that, 0.2345%. Added with other insurance and financial spending, the more organic parts of GDP would have been just 1.77% on their own in Q4.
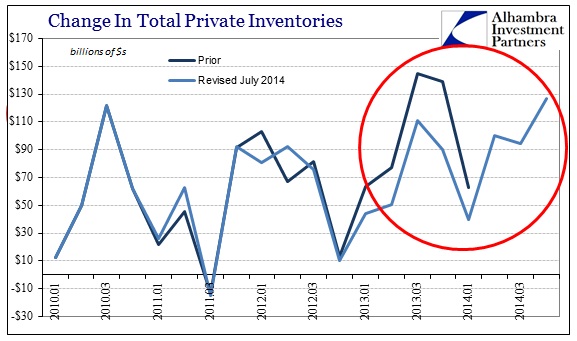
Of course, inventory has played a huge role in variability to GDP lately, accounting for 0.82% in the latest accounts. Without those three segments, GDP was just 0.95%.
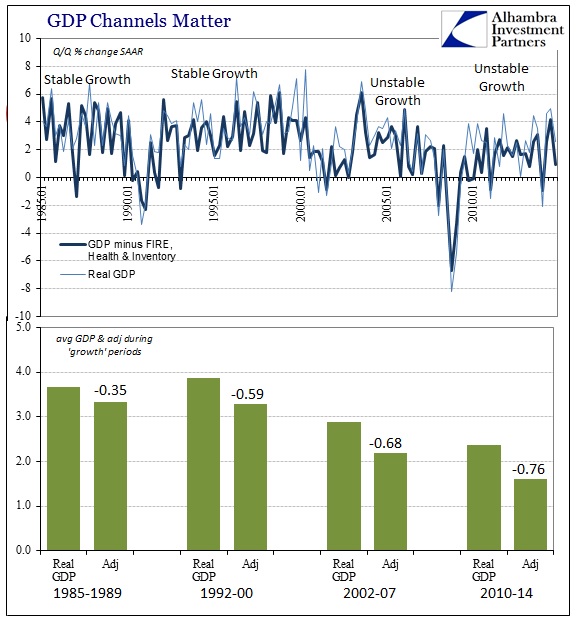
Removing just these three components of redistribution reveal the underlying instability in this “recovery”; instability that didn’t exist prior to the bubble periods. As you can see above, there wasn’t much difference, on average, between real GDP growth and the adjusted figures. Real GDP was also much, much higher, and thus far more consistent. It’s no wonder that employment growth was far, far better and stronger as the economy was actually advancing and less susceptible to the slightest “shocks.”
The standard deviations in the periods highlighted above were comparable, but when the average is much less that makes a huge difference. In other words, variability in GDP in the pre-bubble age(s) meant growth in quarters moving between 2-6%, with 2% as an almost hard minimum, while growth in the latest “cycle” moves between 0-4% with a couple negative quarters thrown in – much greater instability. The lower growth rate then is just the mathematical expression of an unstable system.
The current recovery period has taken that to an even greater degree than during the housing bubble (which featured the artificial, purely financial stabilizer of houses as ATM’s). The adjusted average since 2010 is just 1.6%, including several very good quarters and several negative – something that is unique in the history of “growth” periods. Until this “cycle” negative quarters were reserved exclusively for recessions or quarters immediately following them.
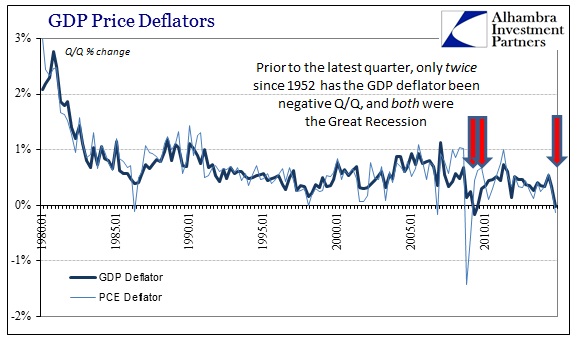
The latest GDP figures also featured another idiosyncrasy, as both the overall GDP deflator and the PCE deflator declined Q/Q. The GDP deflator has only declined twice prior to this latest figure since 1952. Both of those came in 2009 (second and third quarters) at the very trough of the Great Recession!
The cumulative interpretation of these figures leads to the same conclusion as has plagued the recovery since its inception in “deflation”, namely that growth is still not stable because of the heavy presence of redistribution in all its forms. GDP, especially in the shorter scales, simply doesn’t capture that well, if at all, since the theory guiding its construction makes no distinction about activity.
As for this latest quarter, the rise in healthcare spending actually helps explain why the Christmas shopping season was so bad (again, GDP can’t distinguish what is really a zero sum game, which may be the most charitable assignment). Add that to the massive inventory increase, which sees the largest build of this “cycle”, and even those most comfortable with GDP as an economic proxy recognize problems ahead. And I haven’t even included the worst quarter for business investment since 2009.

