
The seasonally finagled headline number for nonfarm payrolls for July increased 209,000. The consensus expectation of Wall Street conomists was for a gain of 220,000. The Wall Street media judged it a “miss.” But the number is the number. The Wall Street economist crowd’s guess was only a little off, considering the total numbers involved. The market plays this silly expectations game every month. It reacts accordingly for 20 minutes, then goes back to the business of whatever it was doing, which in the current case, was falling off a cliff.
The seasonally adjusted monthly gain in payrolls equated to an annualized gain of roughly 2.5 million or 1.8%. But actual, not seasonally adjusted (NSA), nonfarm payrolls fell by 1.1 million in July to a total of 138.7 million. July always shows a decline. The 10 year average change for July was a drop of 1.28 million. This July’s performance was slightly better than average.
The actual annual growth rate was +1.92%. The actual change in July was better than the 10 year average for this month and similar to the July 2013 change. July’s data was absolutely consistent with the trend of the past several years.
The annual rate of change has been between 1.55% and 1.92% for more than 2 years. This month’s reading hit the peak level reached in February 2012, while the Fed was in a QE pause. Meanwhile, the Fed has grown its balance sheet by 24% over the past year, and stock prices have risen 13% even after the big selloff of the past few days.
Meanwhile job growth has remained constant whether QE was going full bore, or was in a pause as in part of 2010, and again in 2011-12. Ben Bernanke’s theory was that stock price gains resulting from QE would stimulate jobs. After 5 1/2 years of massive Fed balance sheet expansion, it’s apparent that he was wrong. A 13% gain in stock prices in the past 12 months has not moved the needle on jobs growth or labor earnings.

The payrolls data is from the BLS establishment survey or CES. The establishment survey of nonfarm payrolls purports to count the total number of jobs. The household survey (CPS) supposedly counts the number of people holding jobs. That survey is the one used to calculate the unemployment rate.
According to the household survey (CPS), actual not seasonally adjusted total employment rose by 161,000 in July.The CPS typically shows a small rise like this in July but the current number was weaker than the 10 year average July gain of 256,000 and weaker than July 2013′s 272,000. It’s inexplicable that the employer survey always shows a drop in July while the household survey virtually always shows a small increase.
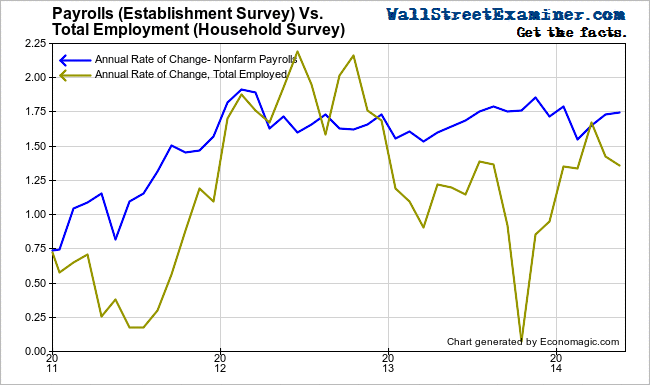
The payrolls data has been growing in more or less a straight line with little change in the growth rate over the past 30 months. Check out the growth rate of payrolls versus the growth of employment per the household survey. I have to question the data, given the wide disparity of results between the two surveys. Which one is closer to the truth?
This month, the total number of payroll jobs according to the establishment survey was 138.7 million. The total number of employed persons according to the household survey was 147.3 million. The difference must be all those self employed eBay sellers. Or perhaps the household survey is overcounting self employed by including people not making any money like, say, real estate sales people working on commission. Is a job with little or no income really a job? I wonder how many “jobs” like that are pushing the unemployment rate down.
Making even less sense is that the BLS says that full time jobs counted in the household survey rose by 428,000 to 119.9 million in July. That was in line with the typical July over the past 10 years. It beat July 2013′s gain of 288,000. Total jobs in the household survey rose just 1.5% year over year but full time jobs rose 1.9%. Apparently full time jobs are crushing it while part time jobs are declining.

In spite of the gains in full time jobs the full time jobs to population ratio stands at only 48.3%. That’s 0.1% less than in July 2009, when the recession hit bottom. The full time employment to population ratio has only recovered to where it was 4 months after the stock market bottom, which was near the lowest point of the recession by most measures. Some pundits are proclaiming that the economy has reached escape velocity. Some escape.
Compare this rate with 51% at the bottom of the 2002-03 recession and 53% in 2006, thanks to the fake jobs spawned by the housing bubble. This economy is still drowning by these standards. The likelihood of getting back to the 53% housing bubble level via a financial engineering bubble is nil. Financial engineering does not create jobs. In fact, the evidence is overwhelming that it destroys them, as it incentivizes corporate executives to purchase company stock rather than expand their businesses.
Meanwhile the Washington-Wall Street self congratulatory media echo chamber has been trumpeting the apparent fact that total jobs have recovered past their pre recession highs. While that may be true of total jobs as they are supposedly counted, it’s not true of full time jobs. They’re still 3.3 million below the July 2007 level. More importantly, the percentage of the population that has jobs is barely above its recession low, and not even remotely close to breaking the long term downtrend.
If the purpose of the Fed’s massive balance sheet expansion really was to stimulate job growth, it has massively and abjectly failed. It has enriched bankers, leveraged speculators, and particularly corporate executives. The Fed has enabled and encouraged them to use free cash from the Fed for massive stock buy backs that increase the leverage on their companies’ balance sheets. Not coincidentally it also enabled them to purchase the stock option grants they had issued to themselves. It’s a nice racket, especially because it’s legal.
But this shell game does not stimulate job creation. Nor does it lift the wages of workers, whose average hourly income has risen just 2% over the past year. That rate hasn’t budged in 4 years, in spite of QE and ZIRP, or more likely, because of them.
The Fed’s Taper of QE is a tacit recognition of those facts. In the face of its massive malfeasance, the Fed has declared victory and implemented staged withdrawal.

