
Data on Federal tax collections comes to us in real time every day, courtesy of the US Treasury. This is unmassaged real data, not the endlessly finagled economic data put out by various other US government agencies. Tracking the tax data regularly enables us to see how the US economy is actually behaving, versus how the government wants you to think it’s behaving.
That said, relative strength in withholding tax collections tended to support the growth in nonfarm payrolls throughout 2016. But what if both sets of data are misleading? What if employers are acting irrationally in adding jobs when their order books don’t justify it? Employers often take their hiring cues from the stock market. And the stock market has never been very good at forecasting the US economy.
There’s ample evidence today that stock prices are misleading employers, and that they are hiring when they shouldn’t be. A Wile E. Coyote moment is coming.
What makes me say this? Other data, such as Excise taxes, Corporate Taxes, and Individual Income Taxes not Withheld (basically small business sole proprietors), are going the other way. The latter half of 2016 saw a persistent trend of negative year to year comparisons in all of these categories.
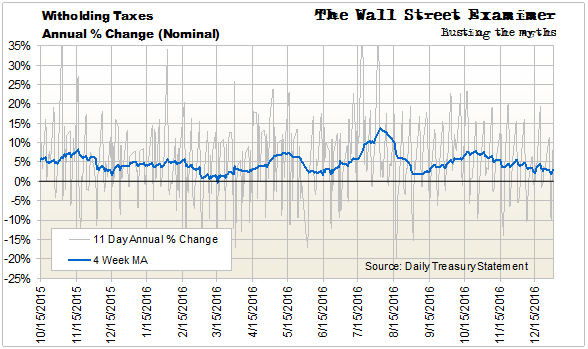
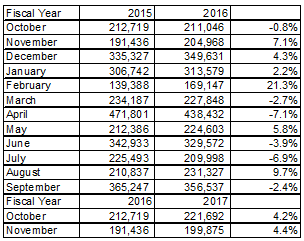
Withholding tax growth was soft in December, but still positive in nominal terms. Withholding taxes had their usual short term cyclical slowing in November following 2 months of increasing collections. The cycle normally lasts 3-4 months. This is a year to year comparison, so this fluctuation is not seasonal. It reflects the normal short term fluctuations in the economy.
The current nominal growth rate is around 2.5%. Adjusted for wage gains, the growth rate is probably closer to zero.
In March 2016, the low of the cycle was zero growth. In the two subsequent cycles, the growth rate dropped to only 2.5%. The May, July, and October growth peaks were also very strong. These numbers foreshadowed the somewhat stronger economic data of recent months. The economic data for December should be a little softer, given 2 months of weaker tax collections. In view of the recent ebullience in the stock market, evidence of economic weakening should be problematic.
As of December 30, the annual growth rate was 2.5%. That’s down from +5% a month before and +4.5% 3 months ago. One year ago the annual rate of change was +4.9%. The economy appears to have slowed in the past couple of months. But we won’t know how the big picture stacks up until the next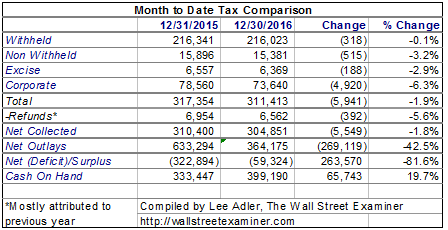 short term growth phase.
Withholding taxes for December from the end of month Daily Treasury Statement were down 0.1% year over year, thanks to calendar anomalies. Last year had an extra calendar day in which taxes could be collected. That would equate with an adjustment factor of 4.5%.
As adjusted for the calendar, the number would be 2.4% higher than the smoothed 4 week smoothed moving average method, which eliminates calendar effects. However, the smoothing results in a lag of about 3 weeks.
The end of month data indicates that growth may have picked up in the second half of November as Trumpophoria took hold. My guess is that this will not be sustainable. Instead it probably only pulled demand from the future as many businesses and individuals accelerated purchase plans that were already in the works.
Other types of taxes would not have any calendar effects since they due at mid month. They were all weaker for the month, resulting in a decline in total tax collections. This is the second straight month in which that has occurred. Two months don’t make a trend, but it’s getting close. If there’s no bounce in January, we could be moving closer to recession.
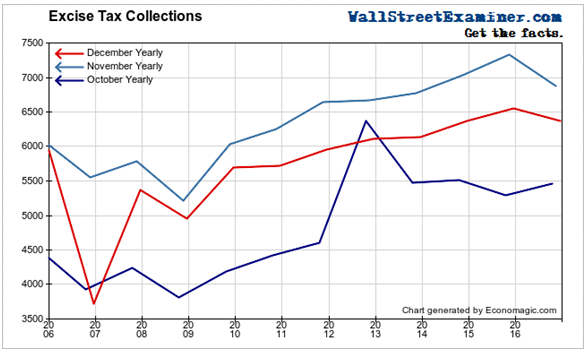
Excise taxes should be less impacted by the calendar, but they have a half month lag. Large payers are required to pay at mid month and the last business day of each month for the period a half month prior. Taxes are based on unit volume, not prices. Therefore they may be an accurate gauge of economic activity independent of any need to adjust for inflation. Excise taxes include gas and aviation fuel taxes, and sin taxes, such as on alcohol, tobacco, and firearms.
They were down by 2.9% in December. That was on the heels of a 6.3% decline in November. October was up 3.4%. The average for the 3 months was -1.9%. October’s uptick was the first positive year to year comparison since a tiny increase in March. There persistence of the negative numbers in this series raises real questions about the true underlying strength of the US economy.
Excise tax collections lag by at least 15 days, with smaller businesses having an even bigger lag as their reporting is less frequent. Therefore, current figures reflect November-December economic activity, rather than for all of December. The declines have been similar going back to May. These numbers have been running counter to the strong withholding tax collections.
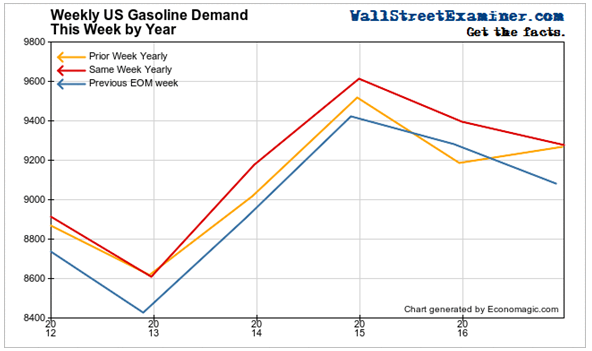
One of the largest components of the Excise Taxes is the Highway Trust Fund tax on gasoline. That data is only provided in the Monthly Treasury Statement which comes out on the 8th business day of the following month. It was down 5.2% in November. Apparently, people are driving less, in another sign that the US economy is not doing as well as the headlines indicate.
The latest weekly data from the EIA for the last week of December also shows gas sales lower compared to the same week last year. They were up year to year in the week before but that was well below the peak at the end of 2014. The last week of November was down year to year. These numbers are pretty weak overall. Two years of declining gasoline sales do not inspire confidence in the US economy.
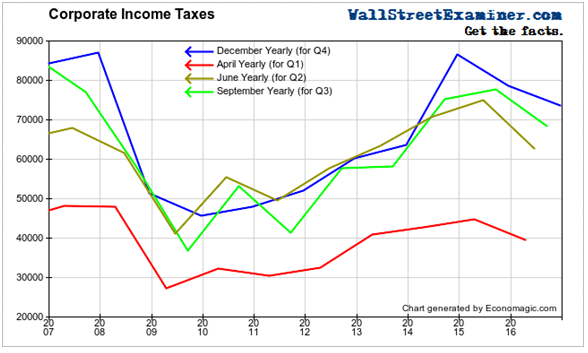
December is a quarterly collection month for corporate income taxes, applying to estimated income for the 4th quarter. Here again we see evidence of a weaker economy in the form of declining corporate profits.
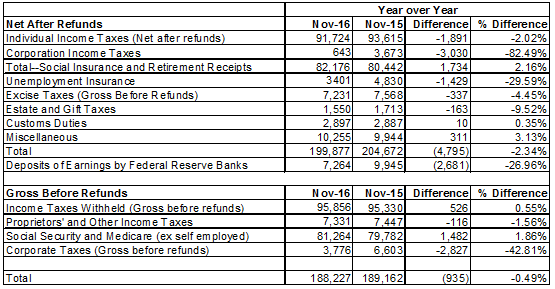
The monthly Treasury Statement, published on the 8th business day of the month, shows the final reconciliation of the government’s revenues and outlays for the preceding month. Gross collections before refunds and net collections are shown below. Net total revenues by month are shown at left. Gross collections are more representative of the current period than are the net collections because net collections include refunds due based on earlier periods.
Gross collections reflect the current period only. They are typically very close to the numbers from the end of month daily statement.
The data below is from the monthly statement for November. Excise taxes and corporate taxes suggest that the US economy was significantly weaker in November than the top line economic data indicated.
The jobs data is particularly anomalous. The withholding tax data was weak due to calendar factors. The rolling 4 week average at the end of November was up 5%. So in that respect, there was support for the strong jobs data. But there is no support in other tax data for employers to be adding workers. Bosses are taking their cues from stock prices, not their order books. They are out of touch with a slowing US economy.
I like to say, “Employers are always the last to get the news… them, and stock investors.” I would be very skeptical of any report of strong jobs numbers for December. It may only be an indicator of irrational employer exuberance. Excise taxes, income taxes paid by small business sole proprietors, and corporate income taxes, simply do not support it.

