
A BIT OF HISTORY
Earlier this week, the market broke above 2080 on the S&P 500 pushing a breakout above the downtrend line that began last May. That breakout required a slight increase in equity risk allocations.
Not surprisingly, I got a tremendous amount of push back this past week from individuals with comments like:
“Makes me scared to be a bull when bears throw in the towel.”
I can certainly understand that sentiment. It would certainly seem that way since I have been extremely risk adverse since last May.
Let’s recap the last couple of week’s of commentary to provide some basis for my “bullish metamorphosis.” [Sarcasm Alert]
“In the chart below, you will note that the previous rallies which took the markets to very overbought short-term conditions (top part of the chart). However, those rallies did not reverse the sell-signal in the lower part of the chart. Each of these previous rallies subsequently failed taking stocks lower. This is why the allocation model remained exposed to lower levels of equity risk during this entire period.”
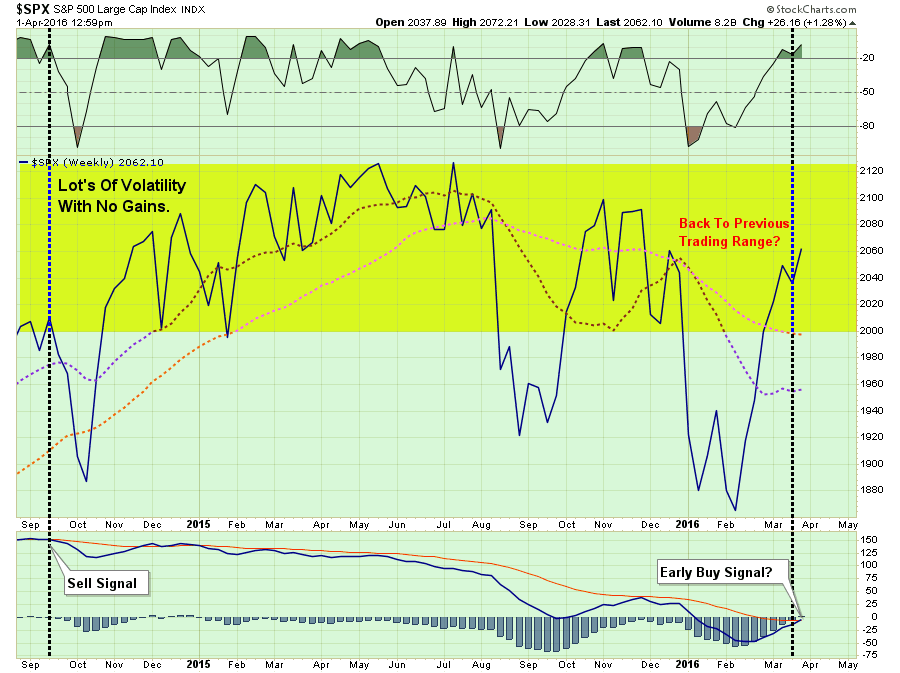
“Currently, as shown above, the short-term dynamics of the market have improved sufficiently enough to trigger an early “buy” signal. This suggests a moderate increase in equity exposure is warranted given a proper opportunity.”
“While allocations have been very conservative since last May, avoiding the ensuing volatile declines last summer and the start of this year, I noted last week the markets had improved technically in the VERY SHORT-TERM which could allow for an increase in equity exposure.“
“While I am on the lookout for an opportunity to modestly increase equity exposure in portfolios given better conditions, I will do so with extreme caution and very close “stop loss” levels. Given the extremely weak underlying fundamentals and NO improvement in the intermediate-term technicals of the market, I do fully expect to be ‘stopped out’ of any additional equity exposure I may add.”
“The breakout above the downtrend resistance suggests a moderate increase in equity exposure is warranted. The breakout also suggests that markets will now try to advance back to old highs from last year.
With the breakout of the market yesterday, and given that “short-term buy signals” are in place I began adding exposure back into portfolios. This is probably the most difficult ‘buy’ I can ever remember making.
First, as a recap, it is worth remembering that I have been at 50% or less exposure in portfolios since May of last year. This has allowed my clients to bypass the market turmoil that occurred last summer and at the beginning of this year. As I discuss in the following video (skip to 11:45) being underweight has cost me very little.“
(You can see the rest of the videos from the economic summit here.)
“However, now, as we move back into a “seemingly” more bullish set-up, I can begin to increase equity allocations modestly.
Notice, I said modestly. I didn’t say go buy every high-beta thing you can get your hands on.”
WHERE AM I NOW
Let me assure you, I am not a raging “bull” by any stretch of the imagination. The fundamentals simply don’t support prices at current levels particularly as economic and earnings data continue to weaken.
Furthermore, let’s keep my recent actions in perspective. Here was my allocation model previously:

And now:

With 35% weighted in bonds and 35% in cash – I am still very conservatively invested.
If I am wrong, and the market plunges by 10% from current levels, the portfolio would be down less than 1.5% from current levels.
However, if the markets continue to build on the bullish momentum and trigger additional “buy” signals, I can continue to scale in more safely as “confirmation” of a return to the longer-term bullish trend is given.
As shown in the chart below, such a confirmation would currently require:
- A consolidation above 2070
- Some short-term relief of overbought conditions
- A push to new all-time highs.

Importantly, as noted, my stop-losses are currently set at 2000. If I am stopped out of my recent equity risk additions, portfolios will suffer roughly a 3.8% loss in each position. On a weighted basis, each position will contribute a loss of 0.19% each.
I can live with that risk considering that portfolios are still well protected following the declines and turmoil from May of last year.
“Buy why didn’t you buy the low?”
Shut up! You didn’t either. In reality, the majority of investors are now “giving thanks” for getting back to even. It is a hollow victory at best. Furthermore, these same individuals didn’t buy the previous low, or the low before that either.
Hindsight is 20/20, and generally speaking, anyone who runs around proclaiming they were prescient enough to buy the previous lows is probably lying or got lucky on a “guess.” But these are the same individuals you will never hear from again following the realization that “permanent market advances” are not a real thing.
However, from a disciplined investment management process, it was only last week there was sufficient evidence the previous low was indeed a short-term bottom. In fact, with the trend clearly negative, lower highs and lower lows, the correction was in the beginning stages of a full-fledged “bear market” decline. It was only massive Central Bank interventions that stemmed that correction.
Since I manage other people’s retirement and life savings, I am not afforded the luxury of “guessing” at entry points.
I have been managing money, in one form or fashion, for nearly 30-years and have seen investors come and go…but mostly go. This is due simply to the lack of an investment discipline, and emotionally driven mistakes, which eventually shift their money to the hands of those with disciplined, pragmatic and conservative approaches. For my client’s sake, this is the side I choose to be on.
You don’t have to like it. You don’t have to follow it. It is just my approach. Take it or leave it.
But there is one point to be made for my approach – I am still here.
HOPE RUNS HIGH
What’s next?
First, let’s remember that the current advance is not built on improving economic or fundamental data. It is built simply on “hope.”
- Hope the economy will improve in the second half of the year.
- Hope that earnings will improve in the second half of the year.
- Hope that oil prices will trade higher even as supply remains elevated.
- Hope the Fed will not raise interest rates this year.
- Hope that global Central Banks will “keep on keepin’ on.”
- Hope that the US Dollar doesn’t rise
- Hope that interest rates remain low.
- Hope that high-yield credit markets remain stable
I am sure I forgot a few things, but you get the point. With valuations expensive, markets overbought, volatility low, and sentiment pushing back into more extreme territory, there are a lot of things that can go wrong.
While the late week correction has been mild, it has succeeded in working off some of the very short-term overbought condition. Concurrently, the number of stocks trading above their 200-dma has surged along with bullish sentiment.

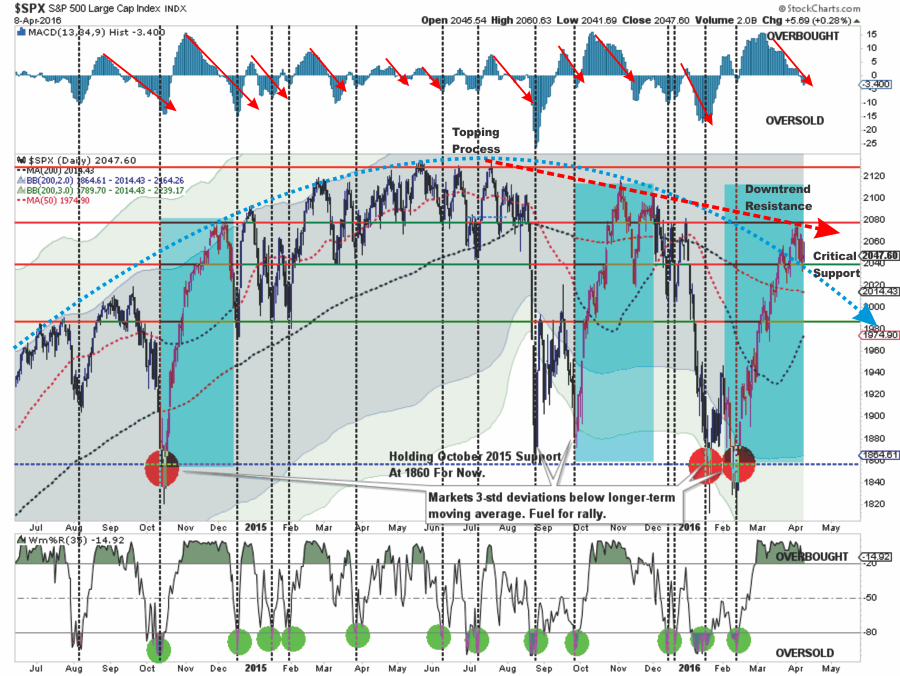
As shown below, the recent surge in asset prices has also turned the 50-dma sharply higher and is in the position of crossing back above the 200-dma. It is worth noting that the last time this occurred, it did fail shortly thereafter.

I can’t really explain the current rally. All I know is that prices are dictating policy at the moment. We can deny it. We can rail against it. We can call it a conspiracy.
But in the “other” famous words of Bill Clinton: “What is…is.”
The markets are currently betting the economy will begin to accelerate later this year. The “hope” that Central Bank actions will indeed spark inflationary pressures and economic growth is a tall order to fill considering it hasn’t worked anywhere previously. If Central Banks are indeed able to keep asset prices inflated long enough for the fundamentals to catch up with the “fantasy” – it will be a first in recorded human history.
My logic suggests that sooner rather than later somebody will yell “fire” in this very crowded theater. When that will be is anyone’s guess.
In other words, this is all probably a “trap.”
But then again, “hope does spring eternal.”
Lance Roberts is a Chief Portfolio Strategist/Economist for Clarity Financial. He is also the host of “The Lance Roberts Show” and Chief Editor of the “Real Investment Advice” website and author of “Real Investment Daily” blog and “Real Investment Report“. Follow Lance on Facebook, Twitter and Linked-In

