
Buried several layers deep in the data beneath the headline economic numbers is always a story that the mainstream media never tells. The Job Opening and Labor Turnover Survey (JOLTS) is no exception.
The media used to ignore the JOLTS. Then they got wind of the fact that it was Janet Yellen’s favorite indicator, and since then they’ve dutifully reported it monthly. Today the Wall Street Journal noted a dip in the seasonally adjusted fictional number of job openings in August, and went on to do some head scratching on the number of hires and quits. There was no discussion on what any of the data implied about the stock market.
That’s my starting point. I look at the long term trends and patterns in the actual, not seasonally adjusted data, and relate that to stock prices. I assume that’s what you want to know. Normally the mainstream media will interview a few Wall Street shills to get their spin on the data. That spin is always based on what will best benefit the shill’s firm’s inventory position, so it’s virtually worthless.
For example, Bloomberg quoted economist Ian Shepardson, whose firm advises institutional investors. He said about the drop in job openings, “Further declines over the next few months would be no big deal…” citing a few ostensibly plausible reasons in support of that opinion.
OK, so his firm is bullish. Surprise. Surprise. On the other hand, if he were a brokerage shill and not a buy side shill, that statement would tell us that his proprietary trading desk has inventory that it wants to mark up and sell. The last thing it wants is public selling, and by this I mean the institutional customers. It needs them to be the buyers of the inventory that the prop desk is distributing. The retail “public,” individual investors, are too small a factor to matter. The pundits are always marketing their inventory to their institutional customers.
When I look at the JOLTS data, I see a picture that suggests that further weakening is likely to be a very big deal. It might not signal the end of Western Civilization, but it could mean that a bear market is coming for stocks. So let’s go to the charts.
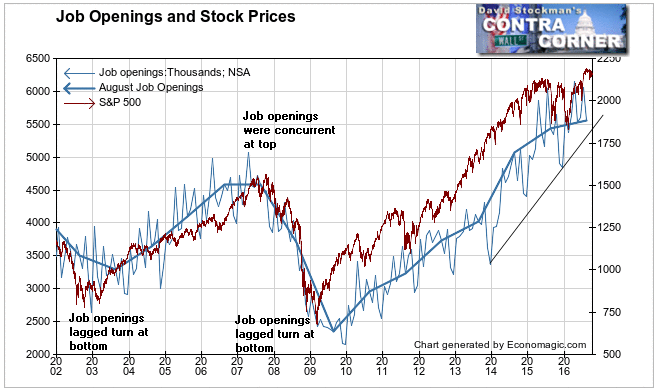
The first thing we note is that the actual not seasonally adjusted number of job openings has slowed but has not turned negative. There is no market-leading signal here.
However, I wouldn’t look for one in this data or any other economic data. Typically the data will be concurrent with or lag turns in stock prices. The 2007 top in job openings was only concurrent with the stock market top in 2007 because stock investors were extremely late in recognizing the seriousness of the housing downturn that had already begun. By mid 2007, businesses were more in touch with the fact that the housing market had seized up.
I would not expect businesses to be ahead of the curve at the coming peak. Their hiring actions lagged at the last two market bottoms. Most economic data typically lags big turns in stocks because liquidity dries up first, sending stock prices lower. Businesses typically take their cues from the stock market, so business activity usually lags stock market turns by a few months. Even if business turns concurrently with stock prices, there’s always the issue of data lag. For example, it’s now mid October and we’re just seeing the JOLTS data from 6 weeks ago.
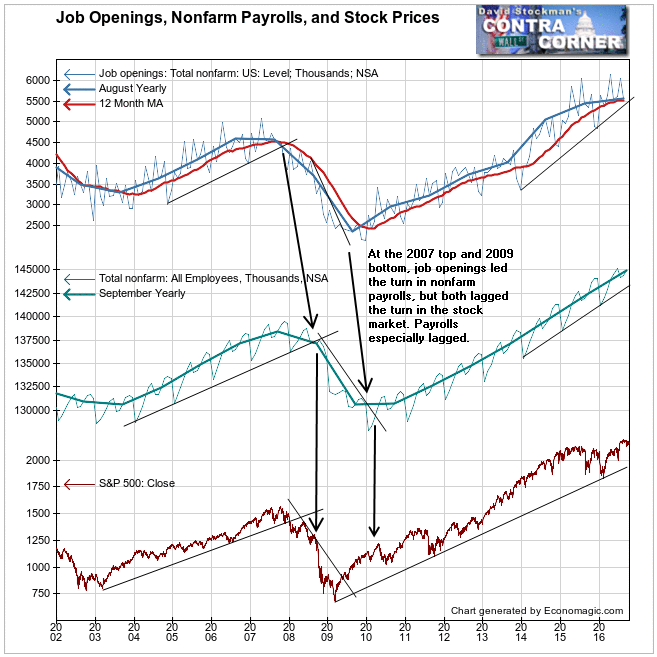
Meanwhile both the August level of job openings, and the yearly line connecting every August have come down to the 12 month moving average. There has been no crossover yet, but this is exactly what happened in August 2007 at the final stock market high. The pattern of month to month behavior of the past 2 years is remarkably similar to the 2006-07 pattern. Because it happened once before does not mean that it will happen the same way twice, but neither can this pattern be ignored. If there’s a crossover at any time in the next few months, it is likely to signal or confirm the onset of the next bear market in stocks.
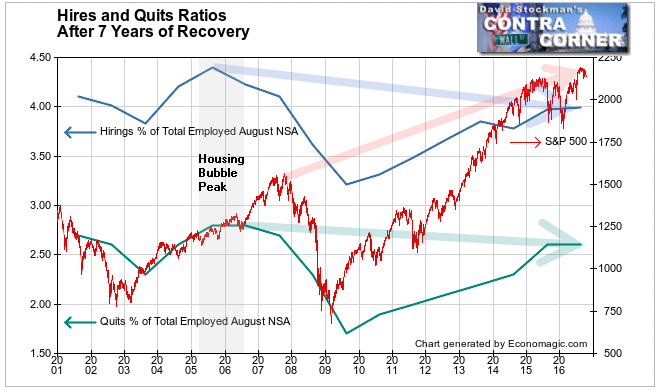
Both total hirings and quits gave advance warning of the 2007 top in stock prices. By then everyone who lived in the real world was well aware that the housing bubble had popped and the party was over. Wall Street professional investors do not live in the real world, however. They live in a make believe world where central bankers are gods, high priests, and wizards. In 2007, they believed in the Grand Wizard of the Central Banker Klan, Ben Bernanke, who told them that the popping housing bubble was contained and that the economy would continue to grow. Most investors only began to realize that that was false in late 2007. That was when financial stress and falling liquidity caused the stock market to fall through its long term uptrend line. Party over.
Grand Wizard Bernanke attempted to justify QE2 in 2010 to Scott Pelley on 60 Minutes, and to the Washington Post. In his now infamous November 2010 Wapo oped, he made higher stock prices a stated policy goal. He justified that with the now discredited, insane idea that high stock prices would trickle down to the masses through the magic of rising business confidence. But apparently business never really became all that confident. Current hiring rates as a percent of total employment are still no better than the levels at the bottom of the 2001-02 recession.
Recently there has also been talk that more people are quitting their jobs in another sign of increased confidence in the economy. The actual data on that tells a different story. The quit rate as a percent of total employment was the same this August as in August 2015. People are quitting at well below the rate at the top of the housing bubble in 2005 and 2006. Furthermore, the quit rate, like the hiring rate, is no better than at the 2001-02 recession levels.
So the mainstream media may be confused by the data, and Wall Street pundits may be sanguine, but I wouldn’t be. There’s enough here to put us on alert that a storm could be brewing just over the horizon.
Lee Adler first reported in 2002 that Fed actions were driving US stock prices. He has tracked and reported on that relationship for his subscribers ever since. Try Lee’s groundbreaking reports on the Fed and the forces that drive Macro Liquidity for 3 months risk free, with a full money back guarantee.

