
The Reagan recovery of the 1980s is not all that the legends crack it up to be, but it is a useful benchmark in the jobs counting game. It came on the heels of what was then the worst recession since the 1930s—including a significant contraction of real GDP (3%), a severe collapse of housing (50%), faltering industrial production (10%), a meltdown of commodity prices and a double-digit unemployment rate that reached 10.7%.
As it happened, the economy hit its pre-recession peak in July 1981 when nonfarm payrolls printed at 91.6 million jobs (well not really, that is the repeatedly revised, reformulated and adjusted official figure for that date—-the original is buried in the BLS data morgue). Needless to say, the picture had dramatically improved 76 months later. By November 1987 the NFP payrolls were 103.4 million, meaning that the US had gained 11.8 million jobs or 13% from the prior peak.
Since we are now also 76 months out from the most recent peak, which was December 2007, it is useful to briefly review the interim cycles. Thus, after the economy peaked at 109.9 nonfarm payrolls in June 1990 the post-recession rebound was also reasonably resilient. By the 76-month marker in October 1996, nonfarm payrolls printed at 120.7 million, signifying a gain of 10.8 million jobs or 10%.
Then a few years later Greenspan’s irrational exuberance turned into the thundering bust of the dotcom market, but this caused hardly a measureable dip in real GDP. In fact, the total decline—as now several times revised—-barely registers at 0.3% or less than one-tenth as severe as the Great Recession drop. So there wasn’t much of an economic hole to climb out. But rebound we did under the impetus of the second Greenspan Bubble—the great housing and credit boom of 2001-2007.
After hitting a pre-recession peak at 132.8 million jobs in February 2001, the NFP payrolls rode the credit/housing bubble to a 138.0 million print by the 76-month marker in June 2007. So this time the rebound was quite modest by historical standards, but the gain of 5.2 million new non-farm payroll jobs still amounted to a 4% advance.
No such luck this time. The April NFP printed at 138.25 million—and that, alas, is still 100,000 jobs below where it was 76 months ago on the eve of the financial crisis and the subsequent Great Recession. In short, we have been in a totally new ball game—a macroeconomic cycle in which so far the monthly jobs print has consisted entirely of born again jobs, not net new jobs.
On the surface its not hard to understand why the Fed, Wall Street and the financial press all focus so intently on the monthly delta—notwithstanding this baleful underlying trend. Namely, they are all playing the same game of monetary “mother-may-I”. That is, one step forward, one month at a time, eyes-wide-shut.
Thus, despite its grotesque violation of all prior monetary principles, the Fed went forward in the last meeting with its 64th consecutive month of zero money market rates; the BLS reported another “favorable” jobs delta; Wall Street spotted an imminent GDP acceleration just a few months down the road for the fifth time in 5 years; and the financial press reported that the polar vortex has passed and that the market could continue rising a few more points until the next crucial “Jobs Friday” i.e. next month.
What delusionary babble! Among everything else, the world does not move in 30 days intervals, the path is not linear and history overwhelmingly proves that no business cycle expansion has eternal life. Indeed, we are now in month 59 of this expansion, and have therefore already overstayed our welcome—the average historical expansion having lasted only 53 months.
And that’s just about averages and ancient history. Yet these benchmarks should provide no comfort whatsoever in the current circumstances. Two things have transpired in the last decade or so that make the 59-month marker far more fraught with danger than it might have been in earlier times.
First, the nation’s balance sheet has been used up—that is, we have reached peak sustainable debt ratios. This means, obviously, that the Fed no longer has the capacity to spur the economy by means of excess credit growth–especially should this long-in-the-tooth cycle weaken or roll-over due to any number of potential external shocks.
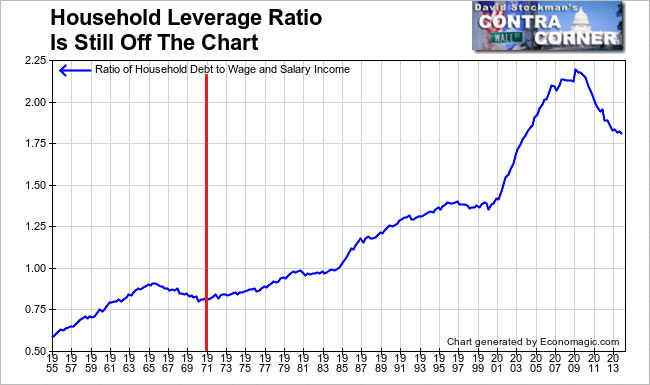
Specifically, Fed policy since the late 1960s has worked primarily through the household credit channel. In essence, with each subsequent macro-cycle the Fed ratcheted up the household leverage ratio, elevating it from a stable baseline at 80% of wage and salary income in the 1960s to a peak of 220% by 2007.
Since the pre-crisis peak, however, the household leverage ratio has made a significant historical reversal, and appropriately so. The nearly parabolic ratchet during 1970-2007 shown below was arithmetically unsustainable and economically dangerous for the borrowers—as was so painfully demonstrated during the housing and credit crash.
So that means that we are now in a drastically different macroeconomic regime. Two sets of figures make this clear. During the the 1981-1987 cycle when there was still plenty of headroom on family balance sheets, the household leverage ratio soared from 105% of wage and salary income in 1981 to more than 120% by 1988—meaning that consumer spending was powered by income growth plus leverage expansion.
By contrast, during the Great Recession cycle household credit finally rolled over after a 40-year binge. Debt now stands at about 180% of wage and salary income—well off the unsustainable peak reached at the top of the bubble in 2007. So for the first time in 50 years, the household leverage ratio has been shrinking during a business expansion—meaning that consumer spending growth has been entirely dependent on the meager income gains of a faltering, low-productivity economy.
Nevertheless, the Fed keeps pushing on a limp credit string–notwithstanding its lack of efficacy. After all, that is the true purpose behind all the buzz words about “monetary accommodation” which emanate from the Eccles Building. The latter term is content-free Fedspeak, and can have no possible meaning other than to embody the fond hope that ultra low interest rates will spur an increase in household and business borrowing and spending.
Self-evidently they have not. The household leverage ratio is still adjusting downward, and the recent modest gains in absolute consumer credit outstanding have been entirely concentrated in student loans and sub-prime auto debt. These extensions keep students and credit impaired households above water, but do not stimulate the robust gains in housing and durables that propelled earlier credit-driven GDP and jobs recoveries.
But the Fed’s error is not merely one of inefficacy. Its massive money printing campaign since September 2008 has operated almost exclusively through an alternative channel—-that is, the Wall Street gambling channel. Under this arrangement, ZIRP fuels the carry trades and results in massive financial asset speculation with virtually free overnight money, while financial repression of long-term rates and the yield curve pushes cap rates to artificially low, uneconomic levels— thereby causing a reciprocal and further overvaluation of financial assets and real estate.
In short, the Fed’s massive stimulus of the Wall Street gambling channel causes a drastic inflation of existing secondary market assets, not an expansion of primary production and income on Main Street. Even in the business channel that is plainly evident.
Total non-financial business credit outstanding has rising from $11.0 trillion at the late 2007 peak to about $13.6 trillion currently. Yet the flow of incremental credit has gone almost exclusively into financial engineering—that is, stock buybacks, LBOs and M&A deals.
By contrast, real net investment in plant and equipment stood at nearly $1.45 trillion in Q4 2007. After six years of massive “accommodation” and a $2.6 trillion gain in nominal business credit outstanding, real spending on plant and equipment in Q1 was still $70 billion or nearly 5% lower than its pre-crisis level.
What this means is that the Fed has become a serial bubble machine. All of its massive “accommodation” is flowing into the Wall Street gambling channel as is plainly evident in the Russell 2000 trading at 100X reported earnings, the extreme froth in the junk debt/LBO market and the maniacal momo chasing that had recently taken social media, biotech and cloud stocks to nearly dotcom style over-valuations.
The evident problem is that the Fed’s Wall Street gambling channel can fuel powerful, prolonged and, in their final stages, parabolic bubbles, but it can’t keep them levitated indefinitely. Bubbles eventually reach an asymptote—a level so extreme and disconnected from fundamentals of income support and realistic present value—that they crash. This can be catalyzed by a black swan event—such as the unexpected collapse of LTCM and Lehman in earlier cycles. Or it can arise from the exhaustion of disbelief among speculators as happened in the end with dotcom, the housing bubble and perhaps now in the final days of the “risk asset” bubble promoted by the Fed since early 2009.
The problem with crashing bubbles is that they disrupt the Main Street economy. Part of this is unavoidable because it represents the liquidation of phony jobs and output generated by the financial bubble itself. Last time that was evident in upwards of 2 million artificial jobs in construction— owing to the uneconomic boom in strip malls, offices, hotels and residential housing construction.
This time it is already evident in the drastic reduction (upwards of 70%) in activity rates and jobs in the mortgage refi sector—an entirely artificial and unsustainable result of the Fed’s QE and financial repression policies.
But busting bubbles also undermine business and consumer confidence, as was evident from the deep but short-lived liquidation of business inventories and excess labor during the nine-month plunge between the Lehman event and the June 20099 recession bottom. In the years since then this vulnerability has become even more pronounced.
It is now self-evident that it’s the top 20% of households who are carrying the consumer spending recovery; and it is stock-option happy corporate executives who have slightly opened the purse strings to discretionary spending for travel, training, software, temp jobs and the like–if not permanent hiring. Yet all of this depends on the bubble’s continued expansion.
In short, when the Fed’s third and mightiest bubble yet of this century crashes, the true structural impairments of the US economy—failures that are lurking in plain sight in the monthly jobs numbers—will become painfully evident. For the fact is, the 7.0 million “born again” NFP jobs that have been posted since the June 2009 bottom are not the same ones which were lost in the Great Recession.
In essence, the US economy has been trading down the quality of it jobs mix at a furious pace–-not only since the financial crisis, but actually since the turn of the century when the Maestro in his infinite folly launched a second housing/credit bubble to counteract the dotcom crash.
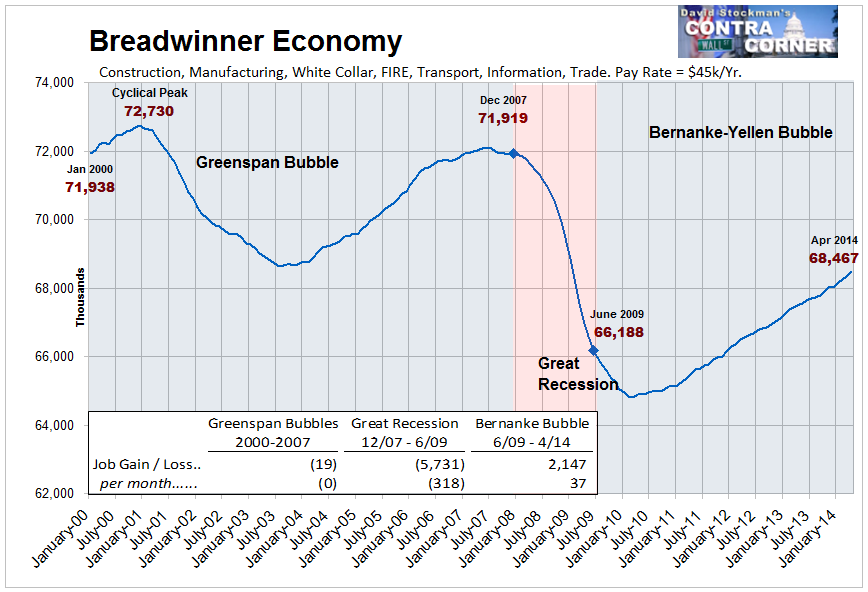
Just exactly 50% of the NFP print consists of “breadwinner jobs” in construction, manufacturing, mining and energy, FIRE, information processing and technology, the white collar professions, wholesale trade and distribution, business support services and core government excluding education. Average annual pay rates in this sector are about $46,000—barely enough to support a family and accrue a modest amount of savings.
As shown below, the Breadwinner jobs count has been shrinking since the turn of the century. No net jobs in this category where generated during the second Greenspan Bubble, and this time we are still deep in the hole. To be precise, 5.7 million or nearly 8% of all breadwinner jobs were lost during the Great Depression, but since June 2009 less than 40% have been “born again”. Indeed, at the 37k jobs per month generated since the recession bottom it would take until 2022 take get back to the level first reached when Bill Clinton was still in the White House!
Needless to say, that is not remotely in the cards. It would mean that the US economy had entered the Keynesian nirvana of permanent full employment and that the business cycle had expanded for 13 years. Its never happened!
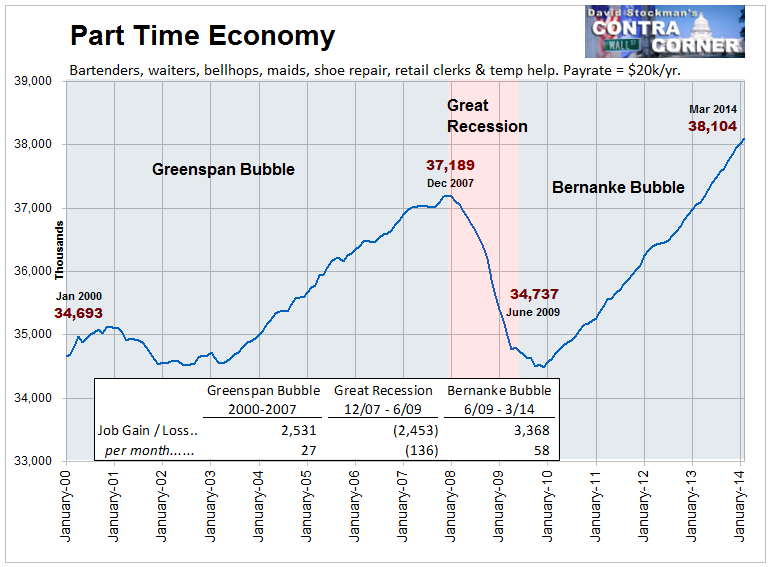
What has happened instead is that during the course of the Fed’s mindless “mother-may-I” policy drive straight into the next bubble crash, the natural recovery mechanisms of the private economy have generated a large number of part-time, temporary and marginal jobs. These pay at an average annual rate of $20k—in retail, bars, restaurants, lodging, entrainment, household services and temp employment agencies.
In fact, these jobs account for half of all the ballyhooed job gains since the recession ended—even though they account for only 28% of the NFP total. And they hardly account for 20% of aggregate wage and salary income—given the fact that from a pay rate point of view these are not even “half jobs”.
Moreover, even here it is evident that the Part-Time Economy is a fragile artifact of the Fed’s serial bubble cycles. As show below, the large gains during the second Greenspan Bubble where quickly blown away during the Great Recession and have only recently exceeded their prior peak. Stated differently, since January 2000, the US economy has generated only 3.6 million net jobs in the Part-Time Economy. That computes to just 20,000 per month—not even a fraction of the adult population growth rate of 150,000.
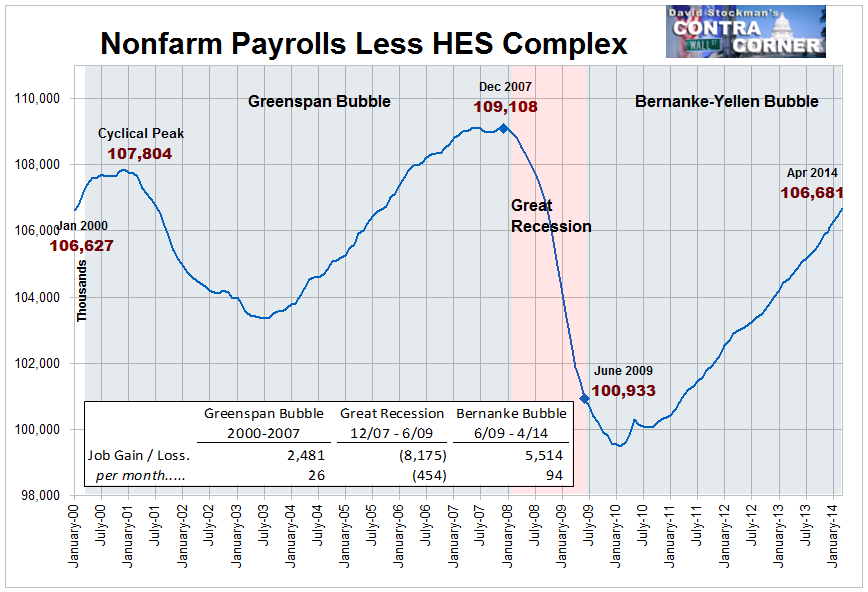
At the end of the day, however, it is actually worse. As is evident from the above two graphs combined, the jobs quality downshift over the last 14 years has just barely maintained the combined print of 106.7 million jobs in these categories from January 2000. That is, the US jobs economy has been running hard in place backwards, and its gotten nowhere.
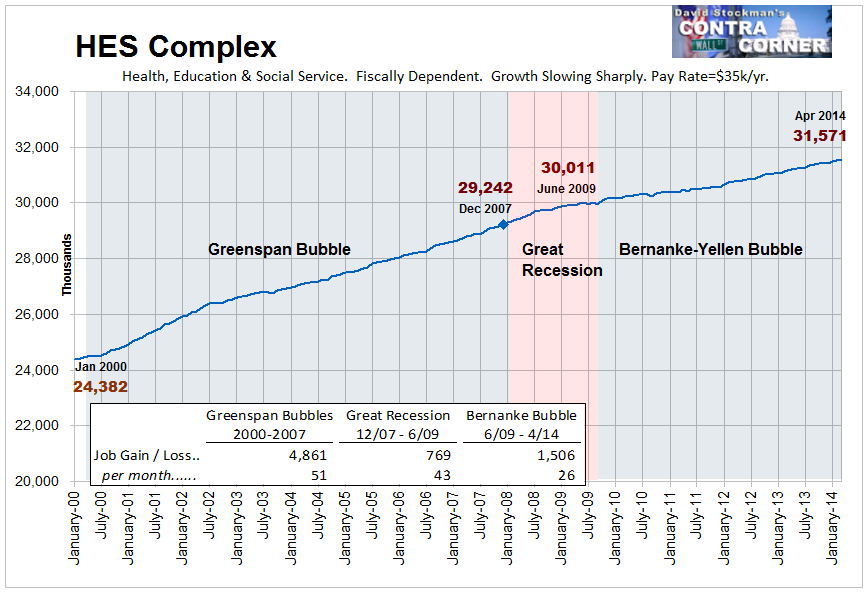
Instead, 100% of the meager gain in total employment over the last 176 months has been in the HES Complex—that is, the fiscally dependent sectors of health, education and social services. A shown here, the rest of the US economy has been literally treading water for nearly a decade-and-one-half.
This graph puts two more nails in the coffin of monetary central planning. In the first instance, most of the spending in these sectors is controlled by third-party payers using government funding or dependent upon deep tax subsidies. The estimated cost of the tax exclusion for employer provided health plans and other medical credits for 2014 is about $200 billion. And add to that nearly $1.2 trillion for Medicare, Medicaid and other directly funding public sector programs.
The point is, the traditional household and business credit channel has nothing to do with the spending rate in the HES-Complex, and therefore the rate of new job creation. It is fiscally dependent, and that means the future path depends on the fiscal health of the public sector—a baleful scenario that need no commentary.
In short, the entire net growth in jobs this century has been generated by a sector of the economy that has also reached peak debt. Its capacity to grow at above GDP rates will therefore be rolling-over for years to come as the baby boom reaches full retirement.
In truth, the mad money printers on the monetary politburo are adding insult to injury. Among the many pernicious effects of ZIRP and QE is that it drastically underprices the carry cost of public sector debt. Politicians are thereby encouraged to kick the fiscal can indefinitely down the road—even as the fiscal system heads straight into the teeth of a massive crisis of transfer payment dependency.
There are now 102 million adult Americans who don’t hold jobs in the monetary economy; that’s up from 75 million or by 27 million just since 2000. It doesn’t matter whether they are students, retirees, disability benefiaries, food stamp recipients or living in mom and dad’s basement, They are overwhelmingly fiscally dependent, and that means that its only going to get worse with time. By 2022 even the BLS estimates there will be upwards of 115 million adults not holding jobs.
But instead of fixing the transfer payment programs and developing a radically new tax regime that can fund this inexorable fiscal burden, the Fed simply sits on the money market rate at zero, pumping up the financial bubble and anesthetizing Washington, one month at a time.
So what we have is this. Our so-called policy leaders are playing the most disastrous game of “mother-may-I” that has ever been conceived by children anywhere.

