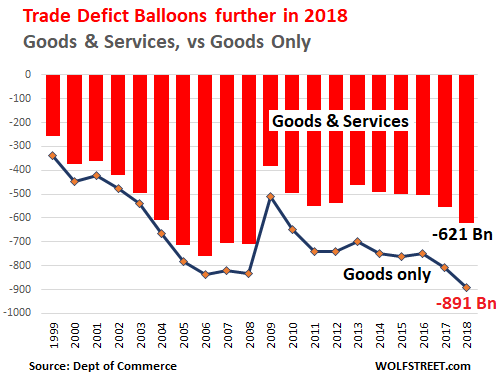
The chart shows the annual trade deficit in goods and services (red columns) versus the deficit in goods only (black line):

The chart shows the annual trade deficit in goods and services (red columns) versus the deficit in goods only (black line):

