
US macro liquidity has grown slowly over the past year. Meanwhile, stock price inflation has surged, setting up a large divergence versus liquidity. It suggests that the market has become overextended due to excessive bullish sentiment. This is the mirror image of the oversold reading in February 2016.
The difference today is that the Fed has announced that it will soon begin withdrawing liquidity from the system. The CLI will flatten later this year and probably turn lower next year. Today’s market overextension represents an extreme level of risk.
My proprietary macro liquidity indicator combines 5 different measures of US systemic liquidity. The most important of these is a measure of the cash flowing from the Fed to the Primary Dealers. Other components include a measure of the change in bank deposits not resulting from flows from money market funds, and several measures of commercial bank trading and investment activities. Finally, I include a measure of direct foreign central bank purchases of US securities.
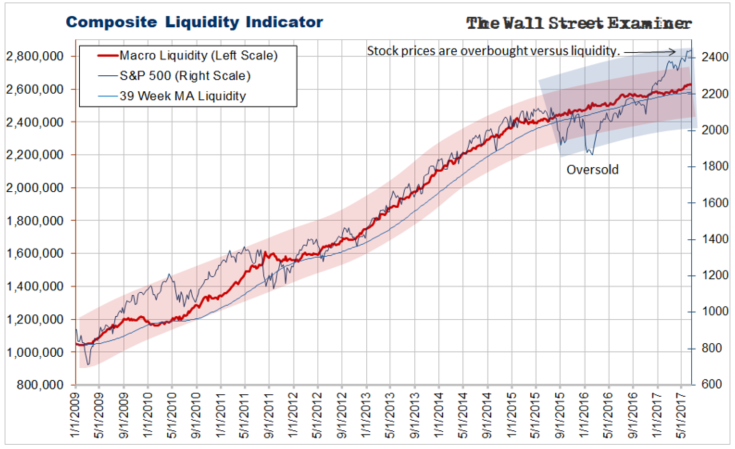
The current wave bandwidth from overbought to oversold has expanded to around 400 points or around 20%. That’s about the same percentage bandwidth as at the start of of this chart in 2009. With liquidity likely to turn down next year, the implication is that the market is likely to decline more than 20% from around current levels. How much more can’t be predicted at this point, but 20% looks like a minimum.
Over the past 12 months, the Liquidity Composite has risen by 3.1%. Stock prices have inflated by nearly 15% over that time. Since July of last year, liquidity has grown by just 2.4%. Stock prices have risen 14.1% over the same period. Stocks are now the most overbought they have been relative to macro liquidity since the market bottomed in 2009.
That was a very different environment with the Fed going full blast on QE. The Fed took its foot off the accelerator at the end of 2014. Soon it will begin to actually siphon gas from the tank.
Macro Liquidity Components
The Fed continues to push more cash into Primary Dealer accounts through replacement purchases of its paid down MBS holdings. These settlements come every month at mid month. Those payments diminished when mortgage rates fell late last year. The Fed’s purchases rose slightly when rates backed down a bit and have been stable at low levels since then.
Net bank deposits (not coming from money market funds) continue to be a positive factor. While US bank loan growth has slowed, deposit growth hasn’t. We can deduce that that’s because of inflows from Europe and elsewhere as foreigners buy US assets. But deposit growth has fallen back to its long term trendline. Any slowing from here will break that trend.
That’s likely to happen as the Fed begins the process of withdrawing cash from the system within the next few months. We don’t know the exact date, but dealers with direct connections to the Fed suggests that the program will be announced no later than the September FOMC meeting.
Foreign central bank (FCB) purchases have been very strong over the past month. US commercial bank buying of Treasuries has been very weak. Those forces are offsetting. However, bank buying has decisively broken a 2 year uptrend. I take this as a warning that the banks are preparing for the coming bear market.
Fed Cash to Primary Dealers
This indicator continues its gradual rise as the Fed buys MBS from dealers each month. This month the Fed added $24.9 billion in cash to Primary Dealer trading accounts in the period June 13-21. This isn’t materially more than the $23.4 billion added in May.
These amounts were all sharply lower than the $35 billion to $46 billion per month that the Fed had been adding from August 2016 through February of this year. The amounts are modest, but they remain a prop for the uptrend. That should continue for another couple of months.
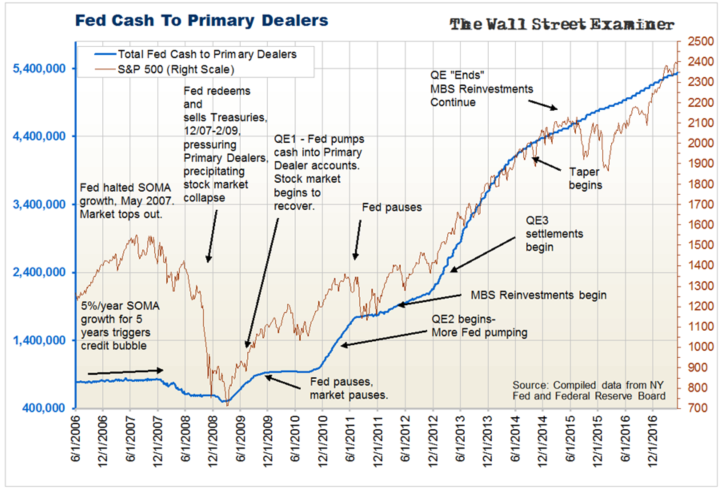
The Fed has sent a signal that it will start reducing its MBS replacement purchases each month “soon.” Initially, that will be a reduction of $4 billion per month. That amount will ratchet up by $4 billion every quarter until it reaches $20 billion per month. The Fed has also said that it will start reducing its rollovers of its Treasury holdings beginning with $6 billion per month, rising to $30 billion per month over the next 4 quarters. Therefore, over the course of one year the Fed will go from $10 billion a month in withdrawals from the banking system to $50 billion a month.
A few of the Primary Dealers who talk to the Fed every day all day suggested that the “normalization” will begin in September. The September FOMC meeting is scheduled for September 19-20. The Fed announces its monthly MBS replacement purchases a month in advance around the 12th-13th of the month. Therefore there should be at least 4 more months of replacement purchases before the Fed starts “normalizing,” aka draining, aka quantitative tightening, or QT.
That would change if the Fed announces that it will began the process at the July meeting. Whichever is the case, the market should top out shortly after the announcement, if not before.
However, there is something we need to beware of if there’s no announcement at the July meeting. With the debt ceiling yet to be raised, the Treasury is likely to be forced to stop issuing new debt by September, if not before. That borrowing pause will continue until a deal is done to raise the debt ceiling. With all new Treasury supply held off the market, this will create a temporary shortage of Treasury debt in the market. At the same time, the Fed will still be pumping around $24 billion per month into dealer accounts.
That lack of supply coupled with paydowns of existing paper could trigger a blowoff in stock and bond prices. It could continue for up to a month or more until the debt ceiling is raised and the Fed begins its draining operations.
Under QT, the Fed will stop rolling over its Treasury holdings. That means that it will call in the money which it had lent the Treasury when it originally bought these bills, notes, and bonds. The Treasury will need to sell new debt to raise the cash it will need to pay off the Fed. When investors buy those bonds, they will send checks to the Treasury from their bank accounts. That will reduce the cash in the banking system. The Treasury will then pay back the Fed, and the money will be extinguished. That will happen continuously until the Fed reverses course.
At the same time the Fed will reduce its MBS replacement purchases. But the mortgage giants, Fannie Mae and Freddie Mac, will continue to sell a relatively constant stream of new MBS as it funds new mortgages. For every reduction in the Fed purchases of MBS, that amount of MBS securities will be sold to the public. The additional supply of MBS on the market will be another depressant for securities prices. At the same time, the paydowns of existing MBS that happen every month will continue. The Fed will receive that cash and won’t use it to buy replacement paper. Instead, it will simply be extinguished when borrowers pay off old existing mortgages.
When the Fed begins this process, the Fed’s System Open Market account, which is the total of the Fed’s securities holdings will shrink. The Fed will not sell paper to the Primary Dealers, so there will be no direct withdrawal of the cash from the Dealer accounts by the Fed. But the dealers will need to buy a portion of the net new Treasury supply. Again, that money will go to the Treasury which will use it to repay the Fed, removing the cash from the system.
Dealer cash will be steadily depleted in this process. I will use that portion of new supply absorbed by the dealers to reduce the total dealer cash represented by the blue line on the Fed- Primary Dealer cash flow chart. As that line descends, stock and bond prices should also decline.
History teaches us that these declines usually become self reinforcing, and they usually devolve into forced selling. That often turns into a crash. The time to take defensive action is now, before the panic starts to roll.

