“U.S. Retail Sales Rose Briskly in October”
screamed the Wall Street Journal on Tuesday. It was talking about the top line seasonally adjusted version of the month to month change, including inflation. Here at Contra Corner we’re not really interested in what the seasonally finagled, nominal numbers say. We want the unvarnished, not seasonally manipulated truth.
Here’s what the Journal said in its lead”
Americans spent briskly at retailers in recent months, supporting hopes for a strong holiday shopping season and giving the economy momentum.
Retail sales—measuring spending at restaurants, clothiers, online stores and other shops—rose 0.8% in October from the prior month, the Commerce Department said Tuesday. Sales grew 1% in September, revised figures showed, up from a previously reported 0.6% increase.
Those gains marked the best two-month stretch of sales in at least two years.
We’re more interested in the actual data, not data that is statistically massaged to create an idealized version of the trend. We’re also more interested in real sales, which is the actual unit volume of sales, instead of the nominal sales, which include inflation.
As a technical analyst, I want to see the momentum of the trend of actual sales from month to month. I don’t want to see the often misleading seasonal adjustment statistical trickery.
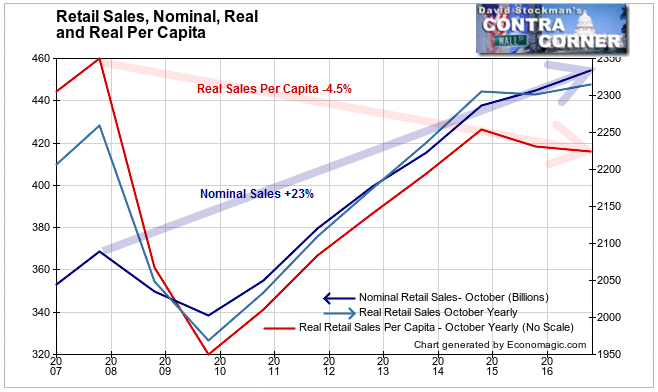
That was particularly true this month. Nominal sales growth was off the charts, but adjusted for inflation, there was no growth. Adjusted for inflation and population growth, sales per capita are declining.
This has been a persistent problem throughout this “recovery.” A few financially fortunate people are spending more. They are skewing the top line upward. But most of us are not spending more. This is a constant theme throughout the economic data.
It’s a Tale of Two Economies. A small slice of the population is doing well enough to make everything look just wonderful on the topline. It belies the fact that most people’s purchasing power is slowly eroding. As I detailed in the study of jobs by industry, many people are losing ground. That trend shows no sign of abating, and the retail sales data shows no sign that things will improve any time soon.
On a month to month basis, nominal sales volume in October rose by 1.5%, which is a lot weaker than normal for October. The 10 year average change for October is +3.4%, but that includes the recession years. Between 2012 and 2014 October’s gains were between 3.3% and 4.9%. This month’s performance was actually the worst October since 2011.
How did the media manage to paint that as a strong month? Simple. Seasonal adjustment.
Now let’s consider the momentum of the trend over a longer period. The Wall Street Journal reported:
Retail sales have picked up more broadly—they rose 4.3% in the past 12 months, the best annual gain in almost two years—due to many factors lifting Americans’ confidence and discretionary income.
That’s just completely false. There’s not a scintilla of truth to it.
The use of seasonally adjusted data to compare the same month year to year is indefensible. It’s the same month! There’s no difference in the seasonality. The only way to accurately compare the same month on a year to year basis is to use the actual, not manipulated data for that month.
On an annual basis the actual, not seasonally manipulated numbers had a year to year increase of +2.1% not +4.3%. 2.1% sounds reasonable enough. It’s near the middle of the annual growth rate range for the previous 12 months, which has been from +0.9% to +6.9%. October’s is a middling performance in nominal terms, reflecting an apparently slow but stable trend uptrend.
How slow?
These numbers include price increases, so unit sales growth is lower. I use the PPI for finished consumer goods as the adjustment factor to convert nominal sales to real sales. CPI includes a wide variety of goods and services not related to retail sales. Housing and medical costs combined constitute more than half the CPI, and the BLS uses convoluted statistical trickery to grossly understate their actual inflation rates. As a result CPI is understated by approximately 0.5% to 1% every year. When CPI is used as a deflator, it usually understates inflation, and therefore measures deflated by CPI overstate real growth.
Conversely, the PPI for finished consumer goods is a far more realistic deflator for retail sales. It is not manipulated to be suppressed like CPI is. Retailers virtually always pass through their increased costs, so PPI for finished consumer goods is a good proxy for retail goods price inflation. The PPI also has the advantage of being available the day after retail sales are posted. CPI is more delayed.
So the 2.1% year to year growth rate of retail sales certainly isn’t really 2%. We know that CPI inflation has been running around 2% lately, so without even testing the data we know that nominal 2.1% growth is near zero real growth. Using the PPI deflator, the annual growth for real retail sales was 0.5%. Considering that US population growth is usually near 1% annually, that means that retail sales per capita have fallen over the past 12 months. Per capital real sales are down -0.2% over the past year.
This table compares growth for each measure we looked at since the 2007 peak, and also over the past 2 years.
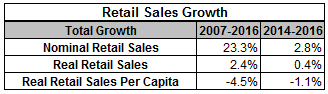
On the basis of the total change since the 2007 peak and over the past 2 years, it’s not a pretty picture. Nominal sales data has presented a completely false picture. The past 2 years are particularly troubling. The trend of per capita sales is evidence that after a strong period, the secular decline is reasserting itself. It’s a bad indication for mid range retailers, and a bad sign for the secular trend of the economy and stock market.