
In last weekend’s newsletter (subscribe for free e-delivery) I discussed the ongoing topping process and the issuance of all three “sell signals,” which only occur at major market peaks. To wit:
“Over the last couple of months, I have repeatedly discussed the deterioration of market breadth, momentum and the fundamental backdrop of the markets.
As shown in the chart below, not only have both lower sell signals been triggered by deterioration in price momentum, the short and long-term moving averages have now crossed.”
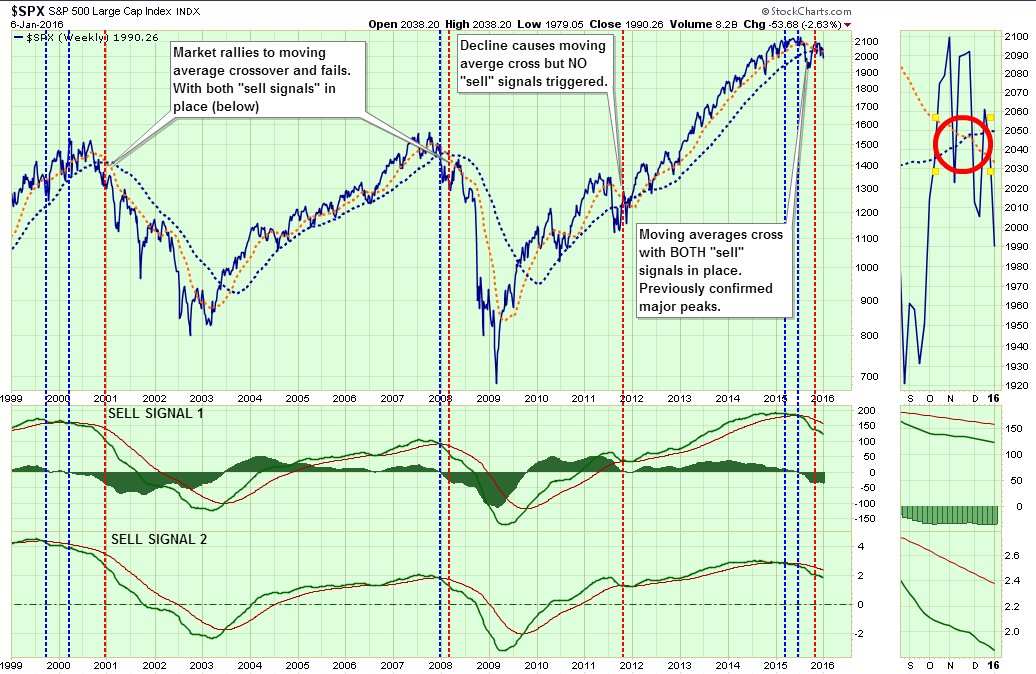
“Since the turn of the century, the two primary moving averages have only crossed three other times – at the peak of the markets in 2001 and early 2008, and in 2011.The difference in 2011 is that while the sharp decline in the prices due to the debt ceiling debate caused the moving averages to cross, the two lower sell signals were not triggered. This kept portfolios allocated more towards equities at that time.
The current topping process, as discussed on Tuesday, is more akin to that seen in 2000 and early 2008. With primary moving averages now crossed, sell signals in place and markets trading below supports, rallies in equities should be used to rebalance portfolios and reduce risk.
While the markets are not ‘technically’ in a ‘bear market’ currently, it is important to remember that they weren’t in 2001 and early 2008 either. Waiting to make adjustments until after full recognition of the event doesn’t leave you many options.”
The problem for most investors during market sell-offs is the emotional desire to “panic sell” declines. Emotionally driven investment decisions never work out well.
Navigating A Trend Change
However, understanding market dynamics, and applying a disciplined approach to your portfolio management practices, will provide for better control over portfolio risk in the long run.
The chart below is a VERY long-term look at the S&P 500 going back to 1965. It is a monthly analysis of changes in price momentum and long-term moving average support.

The vertical orange lines are when SELL signals were issued as both momentum turned negative and prices violated the long-term moving average. Conversely, the vertical blue lines are BUY signals when market dynamics reversed to the positive.
Currently, the markets are registering the first confirmed set of monthly SELL signals since the peak of the market in late 2007.
“Oh my gosh, the markets are going to crash I need to sell everything now.”
Stop! That is emotion at work.
With all of the alarm bells currently triggering, the initial “emotionally” driven response is most likely an urge to go look at your portfolio statement and start pushing the “sell” button. Don’t Do It!
On a short-term basis, prices oscillate back and forth like a rubber band be pulled and let loose. Physics state that a rubber band stretched in one direction, will initially travel an equal distance in the opposite direction when released.
Take a look at the chart below.
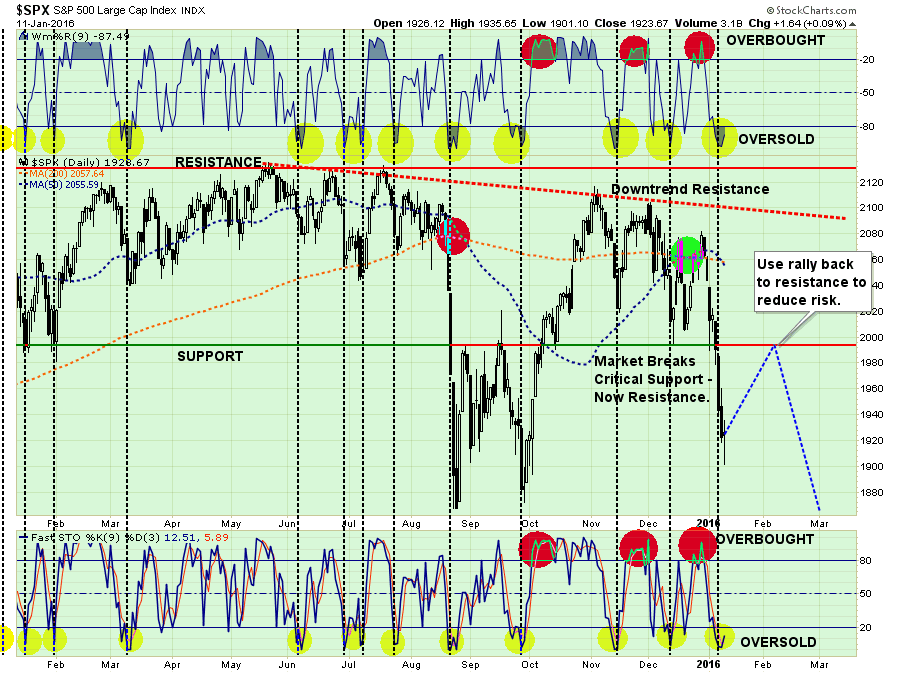
In particular note the top and bottom portions of the chart. These two indicators measure the “over-bought” and “over-sold” conditions of the market. As with the rubber band example above, you will notice that when these indicators get stretched to the downside, there is an effective “snap back” in fairly short order.
With the markets having issued multiple sell signals, broken very important support and both technical and fundamental deterioration in progress, it is suggested that investors use these “snap back” rallies to reduce equity risk in portfolios.
Whatever relief rally comes, starting today, will likely be brief in nature. It is suggested that some actions are taken within portfolios to reduce excess exposure to risk.
A Note On Risk Management
There are no great investors of our time that “buy and hold” investments. Even the great Warren Buffett occasionally sells investments. Successful investors look to buy when they see value and sell when value no longer exists.
Investing for the long-term requires attention, patience and discipline. Things that work today, will not work tomorrow. Companies that are great investments today, will not be in the future. That financial markets are a living, breathing, reflection of the psychology of the herd of individuals making buy/sell decisions on a daily basis.
Just like a school of fish, the direction of the markets can take a swift and unexpected turn at moments notice leaving you exposed to the risk that prevails.
While there are many sophisticated methods of handling risk within a portfolio, the use of a simplistic method of price analysis can be a valuable tool over long-term holding periods. Will such a method ALWAYS be right? Absolutely not. However, will such a method keep you from losing large amounts of capital? Absolutely.
The chart below shows a simple moving average crossover study. The actual moving averages used are not important, but what is clear is that using a basic form of price movement analysis can provide a useful identification of periods when portfolio risk should be REDUCED. Importantly, I did not say risk should be eliminated; just reduced.
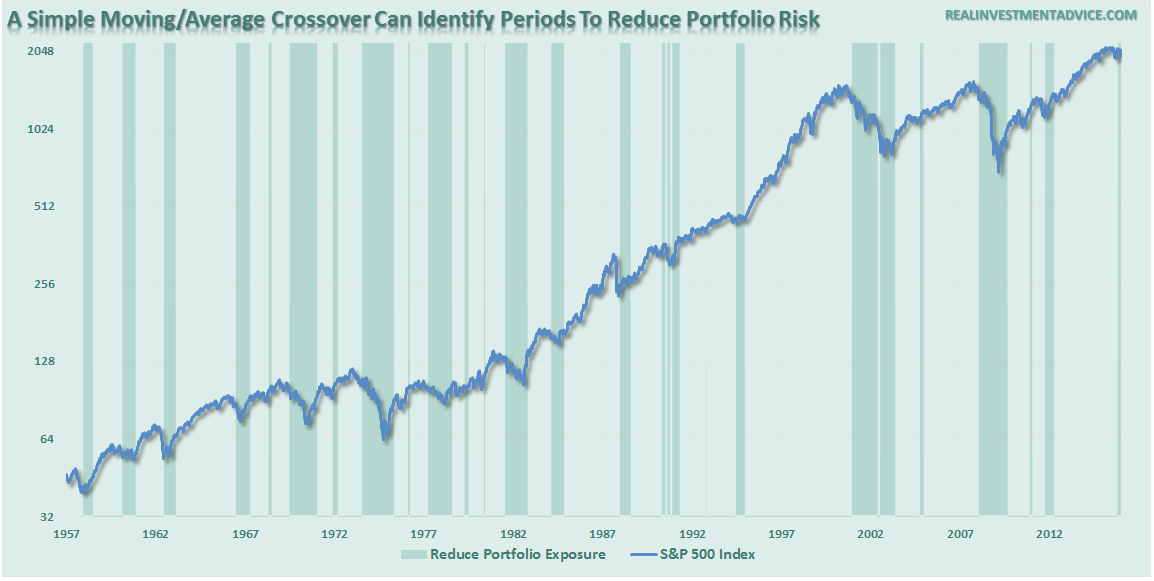
Again, I am not implying, suggesting or stating that such signals mean going 100% to cash. What I am suggesting is that when “sell signals” are given that is the time when individuals should perform some basic portfolio risk management such as:
- Trim back winning positions to original portfolio weights: Investment Rule: Let Winners Run
- Sell positions that simply are not working (if the position was not working in a rising market, it likely won’t in a declining market.) Investment Rule: Cut Losers Short
- Hold the cash raised from these activities until the next buying opportunity occurs. Investment Rule: Buy Low
Missing The 10 Worst Days
The reason that portfolio risk management is so crucial is that it is not “missing the 10-best days” that is important, it is “missing the 10-worst days.” The chart below shows the comparison of $100,000 invested in the S&P 500 Index (log scale base 2) and the return when adjusted for missing the 10 best and worst days.
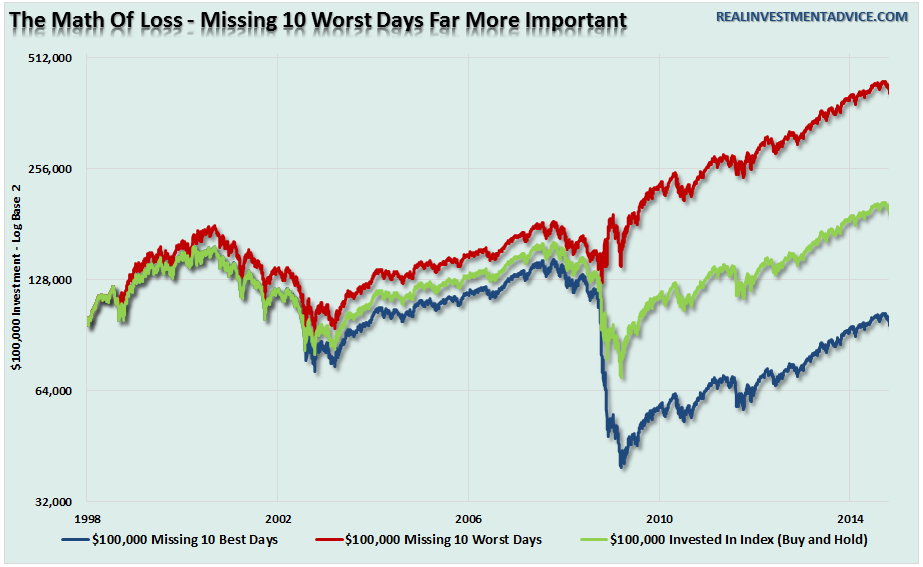
Clearly, avoiding major draw-downs in the market is key to long-term investment success. If I am not spending the bulk of my time making up previous losses in my portfolio, I spend more time compounding my invested dollars towards my long term goals.
You Can’t Handle The Volatility
Despite the mainstream attempt at convincing you that it is “time in the market” that matters, the reality is that there have been many periods in history where you simply “ran out of time.” As shown, when adjusted for inflation, there are several 20-year periods in history where market returns have resulted in either low or negative outcomes.
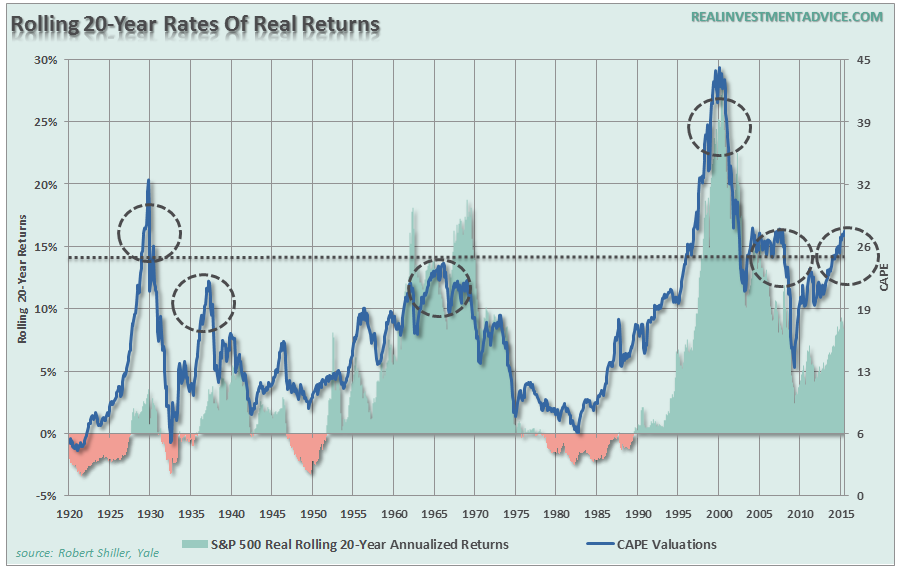
Of course, such dismal forward returns have only occurred when the starting 10-year cyclically adjusted P/E ratio was above 23x earnings. At nearly 26x earnings, this would suggest that “time in the market” may not be as beneficial over the next 20-years.
More importantly, it is the “human factor” that leads to the poorest of outcomes over time. When markets are strongly trending positively, the emotion of “greed” leads to a diminished understanding of risk contained within portfolios. Even the worst possible investment mistakes are masked by a strongly rising prices.
(It is near the peak of these periods when articles espousing “this time is different” and chastising those that “missed the rally…”)
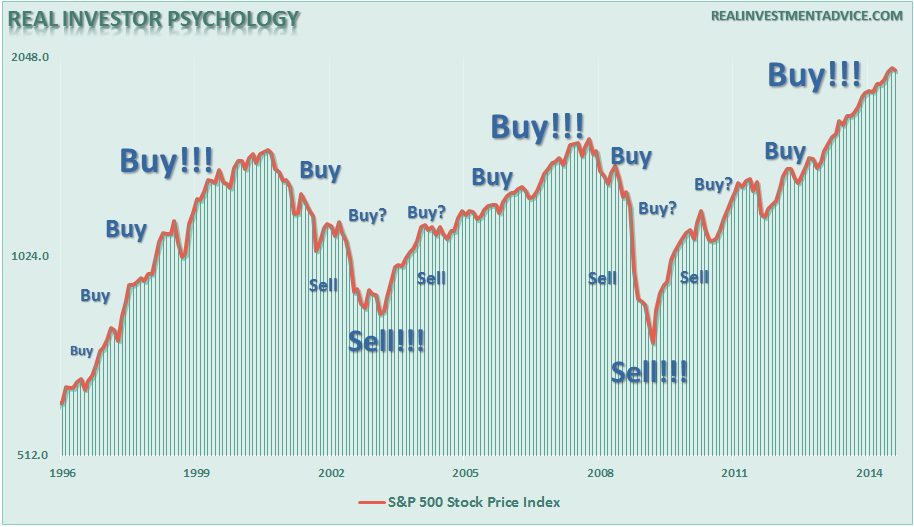
However, it is only after a significant decline in prices, and a large amount of capital destruction, that individuals “panic sell” to stop the “pain of loss” as the risk in portfolios is realized. This is where investors do the most damage to their long-term portfolio goals. I have published the following “investor psychology” chart many times in the past – the message is all too clear.
Let me reiterate this point. A strict discipline of portfolio risk management will NOT eliminate all losses in portfolios. However, it will minimize the capital destruction to a level that can be dealt with logically rather than emotionally.
There is no reason to “benchmark” your portfolio to some random index. Investing is not a competition and, as history shows, there are horrid consequences for treating it as such. This is why incorporating some method of managing the inherent risk of investing over full-market cycle.
In the long run, you probably will NOT beat the index, but you are likely to achieve your financial goals which is why you invested in the first place.

Lance Roberts
Lance Roberts is a Chief Portfolio Strategist/Economist for Clarity Financial. He is also the host of “The Lance Roberts Show” and Chief Editor of the “Real Investment Advice” website and author of “Real Investment Daily” blog and “Real Investment Report“. Follow Lance on Facebook, Twitter, and Linked-In

