
Motor vehicle sales data usually doesn’t get a lot of media attention, but this month the numbers were so bad that it did. The Wall Street Journal and other media finally noticed. The Journal led with the following:
Auto Makers March Sales Raise Concern About Inventory, Pricing
Results were worse than analysts expected and deal a sluggish start to spring selling season
Car sales unexpectedly slid in March, heightening concerns about bloated dealer stocks and pricing pressure in an industry that has been central to U.S. economic growth.
Amazing. They finally noticed. I have been reporting that the comparisons have been negative for the past year, thanks to our focus on the not seasonally adjusted (NSA) actual data rather than the seasonally adjusted (SA) numbers.
The headline numbers are a statistical impression of actuality, not the actual numbers themselves. As a result, they may be misleading, and they usually have a lag of several months in recognizing that the trend has changed. That was the case here.
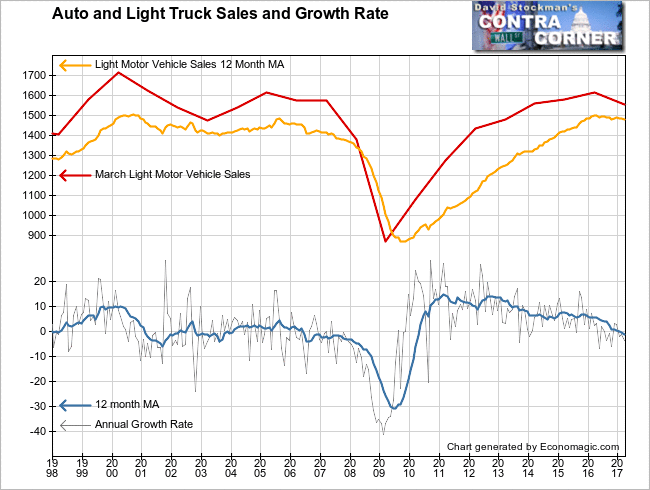
By plotting actual data, we can usually spot trend changes early in the game. Annual rate of change measures often give leading indications of those changes. Between watching actual NSA data and annual rates of change, we spotted the first signs of a downturn in sales when it actually happened, which was early in 2016.
Since then sales have continued to weaken. The growth rate has been negative for most months over the past year.
And as auto industry veteran Wolf Richter of Wolfstreet.com pointed out, this drop in sales has been in spite of the dealers giving buyers enormous sales incentives. He says:
This wouldn’t be so bad – just an “unexpected” sales decline – if automakers had not shelled out $3,768 in incentives per new vehicle sold, the highest ever for any March, according to J.D. Power. This would be about 10.4% of suggested retail price. The prior record for March occurred in 2009 as the industry was collapsing.
The dealers have scraped the bottom of the subprime credit barrel for buyers. Now they have had to cut the effective selling price by more than 10% just to maintain sluggish sales. The next sound you hear will be that of the bottom dropping out.
Auto sales data is useful for investors. It is tmely, released just a few days after the monthly reporting period. The NSA data is not manipulated by government statisticians. It’s based on actual sales reported by the manufacturers. Unlike virtually all government economic data, there’s no estimating, interpolating, extrapolating, and expectorating cooked data. There’s no seasonal manipulation. And there’s no inflation component to adjust. It’s hard data on the unit volume of sales.
There’s also plenty of historical data, so we can see how sales are performing not just in the short run, but also over the long term. By charting the data, we can see both the short term momentum of the US economy and its long term secular growth.
When we last reviewed the data in February it suggested that it was not a good time to be investing in stocks. The message is the same today. With the trend now 2 months further along, and stock prices even higher, in fact the warning is growing in urgency.
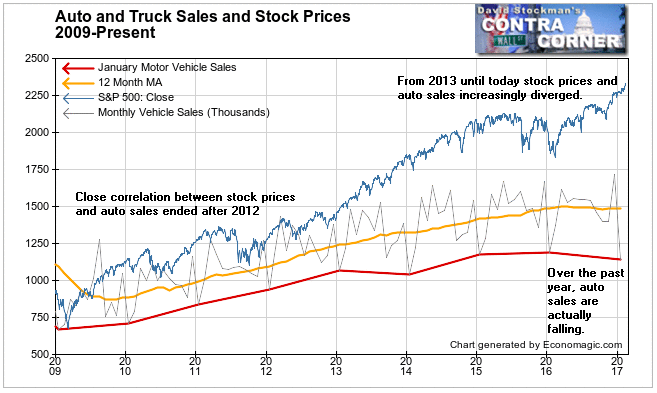
Economic data needs to correlate well with stock prices to be of value to investors. I pointed out back in February that, “Auto sales data does, but there has been a telling change in recent years. The correlation has been veering away from the normal relationship with stock prices since 2013.” Instead a huge negative divergence developed as stock prices raced ahead and auto sales slowed and then stagnated.
Again from my February report:
In the case of the high correlation between auto sales and stock prices, there’s a prima facie case of cause and effect. Clearly, rising auto sales don’t cause rising stock prices. But all of us either have used a stock market profit to make a big ticket purchase, or know someone who has. Or we know people who have felt more secure financially as a result of rising stock prices, and have made purchases because of that.
Rising stock prices can induce some people to make purchases that they might otherwise might not have made. We also know that this relationship doesn’t apply to everyone, and only works for so long. Then it doesn’t work any more. It is artificial stimulus that is always accompanied by an increase in debt. In the long run, that debt becomes a drag.
Auto sales and stock prices are both dependent to a great extent on the common driver of monetary policy. Easy money tends to contribute to both stock purchases and automobile purchases. So it is no surprise that for decades the two series moved in close correlation to one another. But again, somewhere along the line, debt morphs from being a driver to being a drag. So the correlation works in both directions.
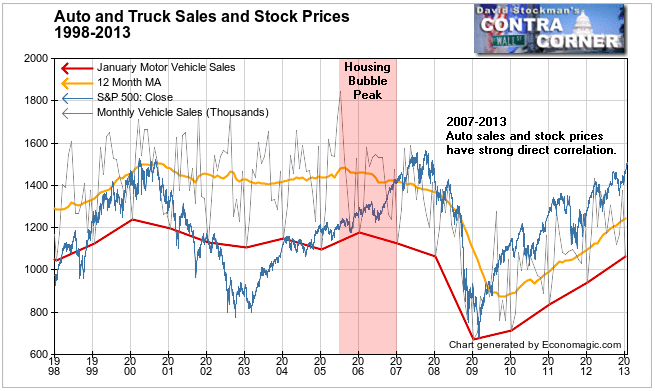
But something strange happened beginning in 2013. The Fed kept printing money and suppressing interest rates, and stock prices kept rising. But light vehicle sales began to diverge. The increasing debt burden was beginning to exert its inevitable drag on the economy.
Apparently, fewer and fewer people were benefiting economically from rising stock prices. This isn’t news of course, but here’s empirical data that supports the case. If a broad segment of the public was actually richer, or feeling richer, they would be buying cars at a pace reflecting the rise in stock prices. Instead, not only has growth in auto sales slowed, it has turned negative over the past year.
According to Motor Intelligence, light vehicle sales, including passenger cars and light trucks, totaled 1.56 million units in March. That was 1.6% lower than in March 2016, continuing the weakening trend. In contrast, stocks had risen about 10% over that period. Here’s how today’s data looks on a chart.
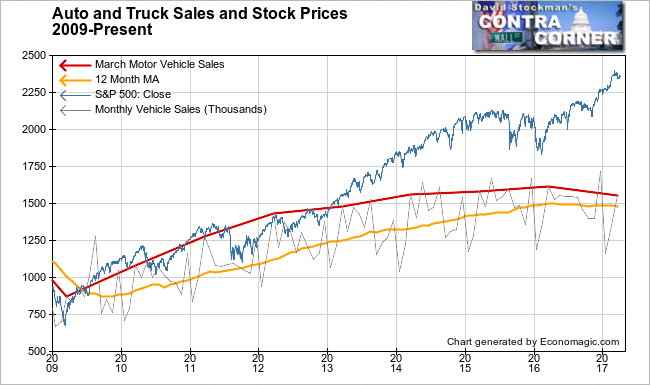
With stock prices bubbling higher and auto sales stalled, the message today as the same as in February. This is not just a bad time to buy stocks, but is probably a good time to sell.
Lee Adler first reported in 2002 that Fed actions were driving US stock prices. He has tracked and reported on that relationship for his subscribers ever since. Try Lee’s groundbreaking reports on the Fed and the Monetary forces that drive market trends for 3 months risk free, with a full money back guarantee. Be in the know. Subscribe now, risk free!
Follow Lee’s weekly market timing reports, including ETF trading recommendations, in the Wall Street Examiner Pro Trader Market Updates. Currently open picks have an average gain of 9.2% and an average holding period of 39 days. Try the service risk free for 90 days.

