
In the rush to make QE’s taper and the follow-on “forward guidance” appear more data-related than of due concerns about the structural (and ultimately philosophical) flaws in the economy, the regressionists of the Federal Reserve have come up with more regressions. The problem was always Ben Bernanke’s rather careless benchmarking to the unemployment rate. In fact, based on nothing more than prior regressions the Fed never expected the rate to drop so quickly.
Given that the denominator was the driving force in that forecast error, the Fed had to scramble to explain itself and its almost immediate violation of what looked like an advertised return to a “rules regime.” When even first mentioning taper in May 2013, Bernanke was careful to allude to the crude deconstruction of the official unemployment as anything but definitive about the state of employment and recovery.
So at Jackson Hole last week, Bernanke’s successor introduced the unemployment rate’s successor in the monetary policy framework. Janet Yellen’s speech directly addressed the inconsistency:
As the recovery progresses, assessments of the degree of remaining slack in the labor market need to become more nuanced because of considerable uncertainty about the level of employment consistent with the Federal Reserve’s dual mandate. Indeed, in its 2012 statement on longer-run goals and monetary policy strategy, the FOMC explicitly recognized that factors determining maximum employment “may change over time and may not be directly measurable,” and that assessments of the level of maximum employment “are necessarily uncertain and subject to revision.”
Economists inside the Fed (remember, these are statisticians far more than anything resembling experts on the economy) have developed a factor model to determine what Yellen noted above – supposedly they will derive “nuance” solely from correlations.
A factor model is a statistical tool intended to extract a small number of unobserved factors that summarize the comovement among a larger set of correlated time series.2 In our model, these factors are assumed to summarize overall labor market conditions.3 What we call the LMCI is the primary source of common variation among 19 labor market indicators. One essential feature of our factor model is that its inference about labor market conditions places greater weight on indicators whose movements are highly correlated with each other. And, when indicators provide disparate signals, the model’s assessment of overall labor market conditions reflects primarily those indicators that are in broad agreement.
Below is their list of the 19 factors included in that statistical conglomeration, the LMCI:
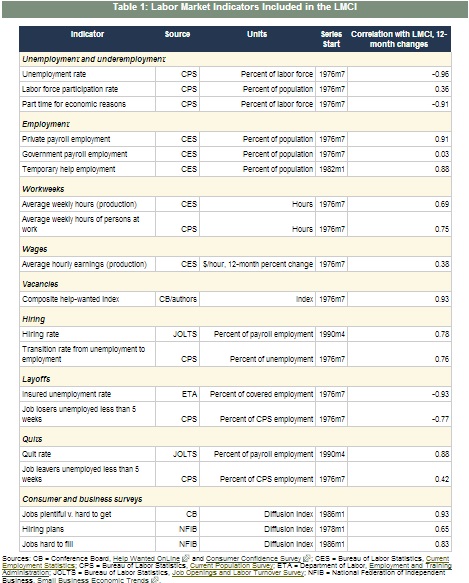
.
Of the nineteen, there are an inordinate number of surveys to go along with the more traditional statistical figurings like the unemployment rate and private payroll employment. What is conspicuously lacking is any measure of income. In fact, of those nineteen only one refers to wages at all and that is the average hourly earnings rather than a more comprehensive measure of earned income. And, as you will note from the far right column, the calculated correlation of the wage figure is the third lowest of the data set.
What does this mathematical reconstruction of the labor market tell us about the labor market? If you believe the figures, this has been one of the best recoveries on record. No, seriously:
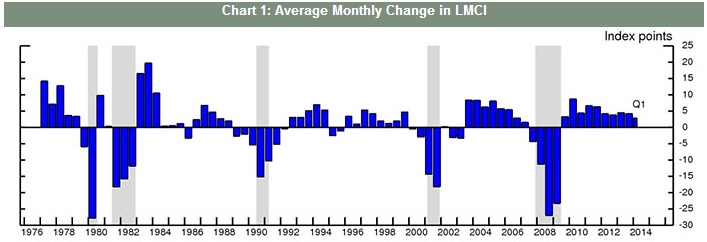
From December 1982 until the official economic peak in July 1990, the Fed’s new tool for nuance gained a total of 319 index points, or an average monthly change of 3. That was during what was an unequivocal and inarguable recovery and robust expansion (we can debate how much of it was artificial, particularly later in the decade, but there was no debate, as now, that economic growth was there).
By comparison, the LMCI shows a total gain of 290 points from July 2009 through what are apparently the latest estimates at the end of Q1. On an average monthly basis, the index in this recovery gained 5 per month, besting by a wide margin the 1982-90 expansion.
The reason for that is the unemployment rate. The Fed helpfully breaks down the contributions to changes in the index and, unsurprisingly, the three largest factors driving this epic recovery in jobs nuance are the Establishment Survey, the estimate of jobless claims and, somehow, the unemployment rate. Those statistical oddities, more than any assurance of actual growth and recovery, actually offer up confirmation bias directly within the index creation.
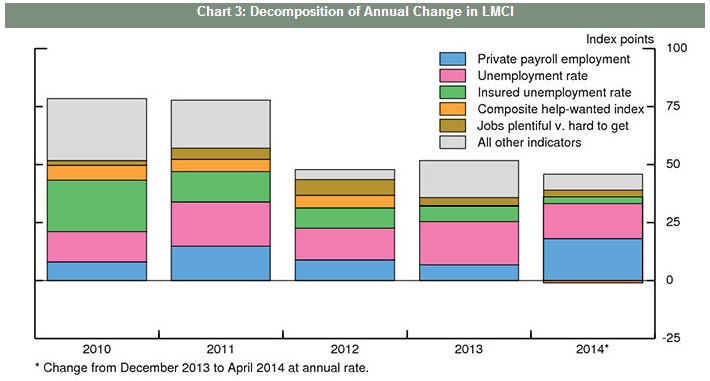
The idea, as Yellen more than suggested last week, was to try to get a handle on labor market slack without “rewarding” the deterioration in labor participation that is inarguably skewing labor perceptions as far, far too positive. So they come up with a new “factor model” where the largest positive contribution still comes from the deterioration in labor participation (the pink portions in the chart above).
If the overall impression of the factor model’s comparison to actual growth in the 1980’s wasn’t enough to disqualify its use, then this surely should be. But rest assured, these kinds of regressions are only going to grow in importance in setting monetary policy under the Yellen regime. The amount of math, which behaved so poorly previously, is set to rise exponentially as actual experience with the actual economy is totally replaced via regression and multi-layered statistics.
This will be called a transition from “discretionary” monetary policy under Bernanke/Greenspan to a “rules based” approach. The latter sounds far more appealing given what has transpired, and even to what the Fed is now willing to admit as largely ineffective. However, it still represents the same old problems as rules or not, when setting those rules in the first place it simply re-arranges discretion from less clearly defined to simply setting the variables. And if the discretion and subjectivity in setting the variables is as poorly constructed as this LMCI, then what does it matter this change in the first place? The answer may be simply PR and “confidence” (the full and various meanings of that word).
Of the models in the Fed’s arsenal, however, this labor “nuance” has to be among the least formidable. It almost seems like it was slapped together haphazardly just to fill the void left by the participation problem cutting into the pre-programmed end to QE. But more than that, it displays exactly the basic kind of ignorance you would expect of a group that places mathematics before understanding (if it isn’t a regression equation, it simply doesn’t exist to them).
Even if the model represented a somewhat realistic assessment, it stills doesn’t tell us much about the actual economic trajectory. By focusing on the beancount raw numbers of these various sub-parts, the FOMC and the orthodox economists using this construction will over-emphasize the most cursory of the labor market aspects – the numerical number of jobs. That, as we well know today, is not much use where the economy is being transformed by “some” structural shift. In other words, the model will count as “good” the replacement of high-value productive jobs with low-value “asset inflation” service jobs (ie, the bartender economy), seeing recovery where only persistent drain exists.
The emphasis on the short run and the persistent appeal to generic activity leaves these mathematicians blind to what a real economy consists of – wealth and the valuable trade of labor for work in productive action. Nowhere does income, the true measure of economic strength, penetrate this moribund monstrosity. That is how this measure can look at the labor market post-2000 and see it as equal or better than what came before.
Back to Yellen:
Second, wage developments reflect not only cyclical but also secular trends that have likely affected the evolution of labor’s share of income in recent years. As I noted, real wages have been rising less rapidly than productivity, implying that real unit labor costs have been declining, a pattern suggesting that there is scope for nominal wages to accelerate from their recent pace without creating meaningful inflationary pressure. However, research suggests that the decline in real unit labor costs may partly reflect secular factors that predate the recession, including changing patterns of production and international trade, as well as measurement issues. If so, productivity growth could continue to outpace real wage gains even when the economy is again operating at its potential.
That is just nonsense – the only way “productivity growth could continue to outpace real wage gains” is under a system of financial repression that substitutes debt for wealth. In other words, nominal redistribution via massive credit production is exchanged for actual economic advance, but since the orthodox practitioner can’t tell the difference (monetary neutrality, after all, must be preserved no matter how much incoherence and convolution is needed to maintain it) it leaves behind all these mysteries in “need” of mathematical solutions, including so many poorly suited to the ideals.
Click here to sign up for our free weekly e-newsletter.
“Wealth preservation and accumulation through thoughtful investing.”
For information on Alhambra Investment Partners’ money management services and global portfolio approach to capital preservation, contact us at: jhudak@alhambrapartners.com

