
As I have said before, the handoff from Bernanke to Yellen was significant not just in terms of background but also in philosophy and viewpoint. Both were strictly academic statisticians (they call themselves economists) but there was an immense shift about QE. To be fair, there is some evidence that thoughts about QE had changed during the last year of Bernanke’s reign, 2013, but without any confirmation (and we won’t get anything close until the transcripts for the 2013 FOMC meetings are released in early 2019) it is just as easy to pin this on personnel.
This relates, of course, to the growing sense of “secular stagnation” that is not just something that appeared out of nowhere. There is a mathematical “sense” to it that has been force-fed upon the FOMC and orthodox economists. Because they prize regressions over actual economy and markets, the CBO’s figures on the economy offer a very good window into this “secular stagnation” creep.
This exercise is illustrative not just for “seeing” secular stagnation approach the monetary models, but in how flawed orthodox theory is from the start. The CBO gives us a sense of where orthodox models place “potential” GDP. That calculation is an updated version of essentially the Phillips Curve, where some level of unemployment and inflation supposedly shows us where the economy “can” grow at full steam without generating orthodox inflation. The CBO calls it “the maximum sustainable output of the economy” and it is derived from much the same calculations as staff economists at the Fed.
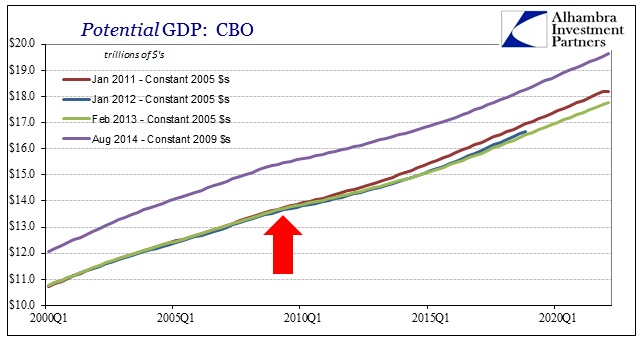
As you can easily surmise from the chart above, the calculation for “potential” output is dynamic. Estimates are being updated just as economic accounts are revised. However, since 2009, the calculations for potential GDP keep moving downward. NOTE: in the chart above, the purple line for the latest, August 2014, CBO figure for “potential GDP” is quoted in constant 2009 $’s rather than the constant 2005 $’s of the other three.

If we focus solely on the “recovery” period, normalizing all the deflated GDP estimates, the downward drift is both obvious and striking. It is very interesting that the initial (for our study here) early 2011 estimate is nearly a straight line, as it was fully expected then to see near-perfect symmetry in the recovery conforming to essentially the plucking model. Three and a half years later, symmetry is completely gone as the latest estimate of “potential” has bent the economic curve shockingly (to economists) and seemingly permanently downward.
Despite this drift in “potential”, the growth rates around 2018 and outward are somehow uniform. For some reason (below), no matter how much the actual economy underperforms, the CBO is dead-set intent on seeing the real economy reach “potential” by 2017. We can see that in their calculations for the “output gap”, which is nothing more than the difference between actual GDP and potential GDP (with a positive “output gap” showing an economy underperforming, and thus in “need” of “stimulus” like QE2). To an economist, a recovery is this kind of mathematical concept where the output gap falls to zero – where GDP matches potential once more.
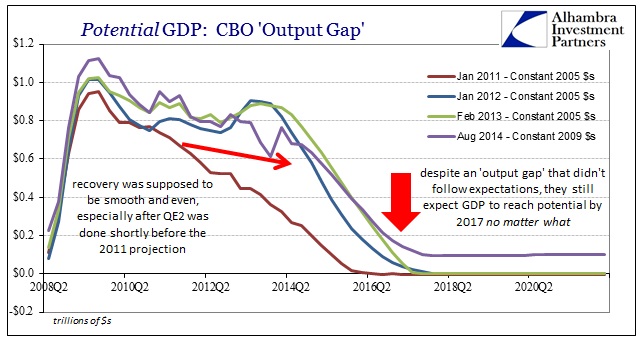
In that 2011 “recovery” projection, especially with QE2 recently administered, the recovery track was set at a smooth and easy return to trend. That would have meant still a rather sluggish recovery, but a full one by the end of 2015. You can see how that never came close to happening, as instead the economy was continually worse than all projections despite that second QE and then a third and a fourth. The output gap has barely improved.
Yet for all that, the CBO still estimates the output gap disappearing (or nearly so, as the latest forecast never erases it fully) sometime in either late 2016 or at the beginning of 2017. Of course, if you hold that variable, attainment of potential or trend, constant, some other variable needs to change. In this case, we get the annual “rite” of optimism.

The CBO, as well as the Fed, has forecast a “big jump” in GDP only just around the corner every year in this “cycle.” And every year as the economy seriously underperforms all projections, that “jump” is pushed outward by the same calendar space. In the January 2012 forecasts, economic growth was to peak in Q2 2015 at just shy of 5%. By February 2013, the peak was pushed to Q2 2016, though at only 4.44%. Now, the peak is the same quarter but at only 3.5%. So this final appearance of “recovery” has not only been pushed back, it has been downgraded quite significantly.

The reason for that is, again, that the economy never lives up to these estimates. Potential or not, actual GDP has remained on a trajectory all its own and away from calculated potential. To the orthodoxy, this simply doesn’t make sense as a full recovery has to be made at some point. Again, that applies not to what you and I experience in the real economy outside academic models, but in the mathematical sense that actual GDP must at some point match potential GDP (regressions are equations, after all, and so there must be equalization). For some reason economists seem to have set that limit at 2017 and eight years of “recovery.”

So when the implied growth rates are downgraded in that “normalization” to early 2017 (when the output gap is supposed to be closed no matter what), what the CBO is really doing is reducing their estimates of “potential” to what should be an alarming degree. That is the only way to “close” the output gap, and quite contrary to all prior experience where the output gap is closed by the simple act of actual economic growth:

If you measured actual GDP and the so-called “output gap” to the 2011 estimate of “potential” you see an economy that has made absolutely no progress in closing that gap to return to trend. So what the CBO has done, or rather has been forced to do, is refigure “potential” downward so that the gap is at least somewhat smaller after five full years of recovery to this point. That is also why it takes annual steps in doing so, as each year the economy fails to live up to whatever passes for trend, leading to yet another year whereby the CBO and economists “have” to either reduce “potential” still further or move the actual recovery date out by a year (which they clearly do not want to do).
That is also why Q1’s negative GDP was so damaging to this case, meaning that the stumble in early 2014 created the academic “necessity” to reduce potential in the latest calculations by the largest amount yet..
That is the essence of “secular stagnation” and it places QE squarely in the crosshairs of economic failure. The intent of QE was not a nice but complimentary piece of “stimulus”, instead believed and expected fully, especially back in 2010 and 2011, to be capable of eventually putting the US economy back to the original potential track within a five-year period. By the judge of the “output gap” shown here by the CBO, which is very important to monetarists and policymakers, QE has been an utter failure in that regard as we are no closer to that original track of “potential” than when the recovery started (and are actually further behind after the 2012 slowdown).
In their own way, backwards as it clearly is, orthodox economists are arriving at the same conclusions common sense dictated many years ago – that QE doesn’t work and probably makes things worse. That leads to the “great” conundrum as it exists globally in the waning months of 2014, as such a downward bend of “potential” was believed impossible. Nothing was supposed to “shave off the peaks” which is what reduced “potential” really means, even if you have to go through this convoluted and ultimately senseless academic exercise to find that out.
If QE didn’t work in the real economy, then it certainly did elsewhere (not consumer inflation, but surely asset inflation), which is why there is a deviation in “stimulus” regimes globally away from these “flood” events and into something hoped more effective (BoJ excluded). In other words, since “secular stagnation” blames some exogenous factor for the “shaved off peaks” then it makes no sense to engage in full QE-type events since the “output gap” is far lower than ever imagined – raw and unbridled “stimulus” cannot change potential, only the gap (as they tell it).
So the orthodoxy is beginning to recognize what is plain by unfiltered sense free from economic bias, but looking at it from the inside out and saying instead, sadly, that this is the best we can hope for. The once-hopeful future provided by market capitalism has been buried by monetarism that still carries on, somehow, that designation when nothing suggests such a relationship is appropriate.
The drastic downgrades to GDP “potential” since early 2011 is, again, both an admission of QE failure as well as recognizing the poor reality of the current circumstance (which includes a reduced sense of future activity). That isn’t included, unfortunately, in the regular FOMC statement that is released at its regular meeting, but such meaning is very plain in all the activities since Yellen took over (or earlier if Bernanke oversaw the turn in philosophy and outlook). So when they refer to the recovery as on-track, that doesn’t even mean what it meant only a few years past. And I have no doubt that such a “recovery” message is willfully misleading as it leaves out all this key context.
As I mentioned yesterday, this is another area which likely explains the position of credit and funding (yield curve, tight “dollar”) in direct opposition to stocks. The former has engaged in “secular stagnation” without need to define the exact cause, while the latter only “hears” recovery from the FOMC without the hidden downgrades because it provides convenient if plainly incomplete rationalization for price behavior. The problem of such insufficiency is that there will come a time when only a real recovery will be enough to withstand so much sustained attrition; which is what this all really gets at even if misguided by the adherence to rigid orthodox tendencies and the math it takes for them to see it. Further, the limits of erosion may be closer than non-credit participants may be aware.

