
By Tyler Durden at ZeroHedge
When it comes to recent inexplicable and notable market divergences, few are as disturbing as the gaping spread between equities and junk bonds, best shown on the chart below.
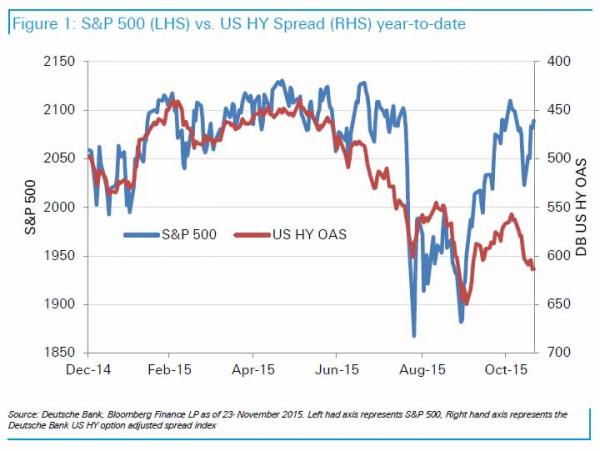
While we have been covering this topic since at least September, when the divergence first appeared, many are starting to ask what is going on. Case in point, DB’s head credit strategist, Jim Reid, who like most, is stumped. To wit:
Last week was the best week for the S&P 500 since December 2014 but US HY continued to under-perform virtually all major comparable asset classes. Sentiment wasn’t helped by the postponement of the Veritas LBO financing which was the largest private equity buy out of the year. The riskiest part of the market continues to be soft. Our US strategist Oleg Melentyev outlined the divergent performance in his note on Friday night. IG bonds are 5bps tighter since late October, while their HY index is 40bps wider. Within HY, BBs have widened by 20bp while CCC spreads jumped by 75bps – over double what would be appropriate given normal betas. Even in the October rally CCCs lagged BBs in absolute terms which is very rare for such a high beta move tighter. It’s not even an Energy story as the numbers are similar with or without.US HY is also now underperforming all major related markets and is even struggling against much of EM. The big question within credit and to the wider global markets community is whether this can be contained or whether it is reflecting a turning and deteriorating credit cycle that is going to be tough to stand in the way of. Our base case at the moment is that the US is late cycle but that there is probably at least another year left of it. We also think Europe is still relatively steady fundamentals wise. As such we’re not inclined to panic by developments in US HY. However it’s something that investors in all asset classes should be keeping an eye on.
They certainly are, and none perhaps better than Reid’s colleague at DB, Oleg Melentyev, whose note we summarized over the weekend but here are the key highlights again:
Segments of credit market diverged in the past couple of weeks with higher quality paper holding up relatively well, while lower quality remaining under meaningful pressure. IG bonds are 5bps tighter since late October, while our HY index is 40bps wider. Within HY, BBs widened by 20bp while CCC spreads jumped by 75bps; keep in mind that normal beta between these two segments is 1.6x, so a 20bp widening in BBs should imply a 35bps move in CCCs. This is a continuation of trend we have seen in October, where the second-strongest post-GFC rebound in HY was in fact driven by stronger tightening in BBs (65bp) than CCCs (53bps). Even ex-Energy, relative performance of these two components was indistinguishable (-62 and -65 bps respectively).* * *
[It] is quite an unprecedented set of circumstances to have a very strong market move tighter that is not led by its higher-beta components. It also gives us a sense of a low level of conviction prevailing among market participants: I don’t want to miss out on the rally and yet I don’t want to touch the high-octane stuff, even ex-energy, as my confidence in issuer fundamentals and persistent low-defaults is diminished.* * *
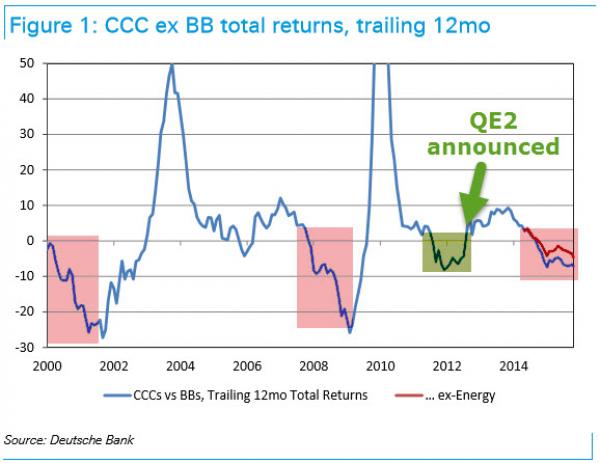
Figure 1 shows how CCCs are now underperforming BBs on a trailing 12-month total return basis, by 700bps all-in and 460bp ex-Energy. There are only three instances of underperformance this deep, two of them coinciding with developing credit cycles in early 2000 and early 2008, and one false positive in late 2011.We have previously addressed the latter case in our Evolution of the Default Cycle piece a few weeks ago, pointing at its differentiating features such as early cycle stage (only 2 years out of the previous recession) and easing policy stance (the Fed expanding on its QEs, not rolling them back or hiking rates).
It gets even weirder:
[An] interesting and unusual development is taking place on a high-level across asset classes, where US HY is now underperforming all major related markets, Including loans (-1.2%), IG (-0.5%), equities (-2.1%), Treasuries (-6%), EU HY (-3.7%) and even external EM sovereigns (-4.3%). The most intriguing detail here, in our view, is that HY is underperforming both IG and equities at the same time. Think about how unusual this is for a moment. If HY is an asset class that sits somewhere in the middle on a risk scale between high quality bonds and equities, then normally we would expect it to be underperforming one and not the other, as they would normally move in opposite directions.
Just as important, the weakness is not just in energy names – as Melentyev notes, the recent bursting of the retail bubble suggests the US consumer is quite sick.
Recent disappointing results announced by retailers ranging from Walmart to Macy’s to Nordstrom to Best Buy has also caught our attention as an odd development. Somehow, we were under the impression that these were supposed to be the best of times for the US consumer: employment trends are strong (as evidenced by nonfarm, claims, and unemployment rate), wages are going higher (21 states raised their minimum wages in 2015, as well as some major private employers such as Walmart, McDonalds), gasoline prices are at 10 year lows as are home heating bills, equities are at cyclical highs, and home values have recovered.So if consumers are cutting on their discretionary spending with all these tailwinds in place, there must be something else going on.
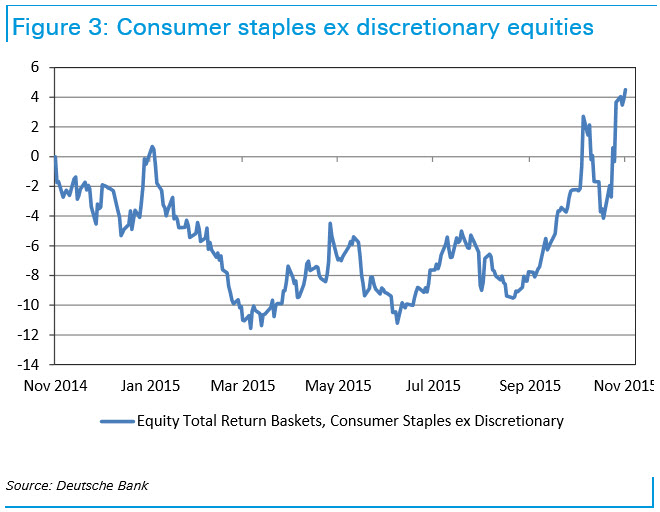
That something else could be the Amazon substitution effect, but as Oleg points out, AMZN revenues were $90 billion compared to $1 trillion for all other US retailers: hardly an offset (and it still has $0 net income, when one strips away the AWS business). Additionally, consumers have not had a problem with purchases of staples – the weakness has been entirely in the discretionary spending space, suggesting something else (coughobamacarecough) is soaking up much of this undisposable income:
Melentyev’s rhetorical conclusion – how are these gaping, unprecedented divergences between virtually every other asset class to stocks possible?
The hardest questions we are trying to reconcile here are how is that possible to see all these signs of weakness under the surface – including weak commodities, tightening credit, retrenching consumer spending – being balanced by very strong equity markets and upbeat employment picture. One of these sides has to be wrong in its assessment of the current macro environment, and seeing both of them extending well into the future appears unlikely to us.
How? Ask the central banks.
As for this divergence ending soon, don’t hold you breath: if these same central banks decide the divergences should extend well into the future with now daily “whatever it takes” statements (even coming from Saudi Arabia as of this morning), expect mass confusion to be the norm for a long, long time.
Source: ‘How is This Possible?’ Deutsche Bank Asks, Looking at the Canary in the Junk Bond Mine – ZeroHedge

