
By Tyler Durden at ZeroHedge
We have previously documented how, with the fourth quarter earnings season almost completed, Q4 EPS are poised to drop by 3.3% Y/Y, making this the third consecutive quarter of declining year over year earnings, in other words an earnings recession and a half.
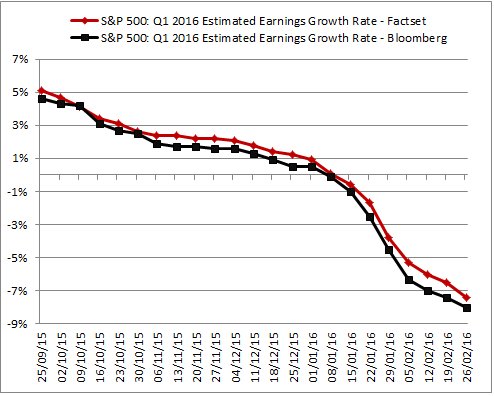
And with this quarter’s earnings almost done, attention shifts to Q1 2016 where things are going from great to bad to absolutely abysmal. Here, it appears that Wall Street was just a “tad overoptimistic” on first quarter’s earnings, as consensus has imploded from a +5% expected increase in YoY EPS as of September 25, to a -7.4% plunge according to Factset (and even worse according to Bloomberg).
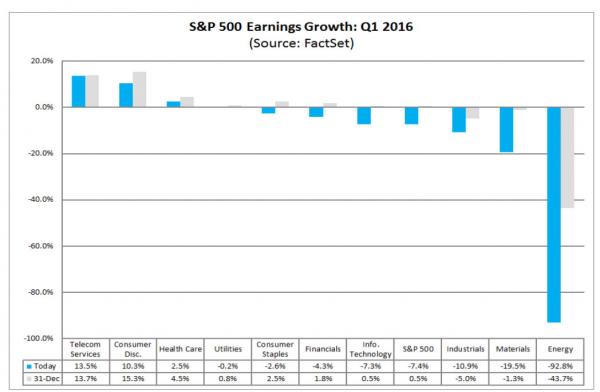
The companies have validated this implosion in earnings: for Q1 88 companies have issued negative EPS guidance and 22 companies have issued positive EPS guidance. Additionally it’s not just energy: in Q1 the following sectors are expected to post annual EPS declines: Energy (-92.8%), Materials (-19.5%), Industrials (-10.9%), Info Tech (-7.3%), Financials (-4.3%), Consumer Staples (-2.6%), and Utilities (-0.2%). In fact, only three of ten sectors are expected to see their EPS rise: Healthcare, Consumer Discretionary and Telecom Services.
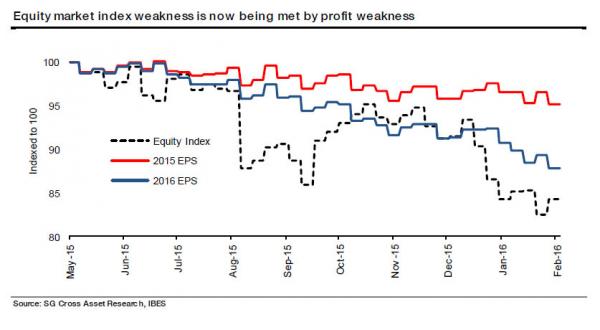
SocGen’s Andrew Lapthorne had some thoughts on this last week saying that “forward earnings expectations are now falling fast, so whilst MSCI World has fallen by around 15% since May last year, 2016 EPS levels are now down 12% over the same period. The poor profit reality is now catching up with weak equity prices.”
What seems to be happening is that the Q4 reporting season is leading to significant cuts to 2016 expectations. Whilst similar effects occurred last year, this is somewhat of a departure from the past when year-ahead forecasts tended to be cut steadily throughout the year. It would appear the perennial bullishness in forward consensus numbers is so out of kilter with economic reality that companies are moving earlier to correct the anomaly to the extent the consensus growth forecast for this year is already fast approaching zero.
Whilst a big part of the downgrade is via the Oil & Gas sector, [there are] big cuts in an ever wider selection of stocks and sectors. Global 2016 EPS forecasts were cut by 3.6% in over the last four weeks or so: we make that the worst monthly cuts to forward estimates since early 2009.
But while near-term forward EPS expectations have been crashing, for now what is keeping full year 2016 EPS up (which have tumbled from +4.3% at the start of the year to just 1.9%) is a hockey stick in Q3 and Q4 EPS expectations that would make the butt of all forecast jokes, the IMF, proud: somehow consensus expects the growth rates for Q3 2016 and Q4 2016 to be +4.7% and +9.4%.
It’s not going to happen.
However, what caught our attention is not the ongoing slaughter in corporate profitability which in any other world would be a sufficient condition to confirm an economic recession; it is what Warren Buffett said earlier about non-GAAP earnings which he blasted in his annual letter:
… it has become common for managers to tell their owners to ignore certain expense items that are all too real. “Stock-based compensation” is the most egregious example. The very name says it all: “compensation.” If compensation isn’t an expense, what is it? And, if real and recurring expenses don’t belong in the calculation of earnings, where in the world do they belong?
Wall Street analysts often play their part in this charade, too, parroting the phony, compensation-ignoring “earnings” figures fed them by managements. Maybe the offending analysts don’t know any better. Or maybe they fear losing “access” to management. Or maybe they are cynical, telling themselves that since everyone else is playing the game, why shouldn’t they go along with it. Whatever their reasoning, these analysts are guilty of propagating misleading numbers that can deceive investors…. When CEOs or investment bankers tout pre-depreciation figures such as EBITDA as a valuation guide, watch their noses lengthen while they speak.
We also decided to not play part in this charade, and took a look at S&P500 earnings on a GAAP and non-GAAP basis. After all, there are those who still say the market is cheap despite what is an earnings bloodbath around the globe.
And indeed, even the unprecedented decline in earnings, non-GAAP 2015 EPS for the S&P500 are poised to print 118, which at an S&P of 1940 implies a P/E multiple of 16.5x. Hardly exorbitant.
And then one looks at the actual, GAAP earnings. What one finds is absolutely shocking.
If using I/B/E/S GAAP earnings, which exclude the barrage of pro-forma write offs, addbacks, “non-recurring items” and countless other “misleading numbers that can deceive investors”, what one gets is a true shocker: instead of 118 in LTM EPS for the S&P 500 (shown in red in the chart below) the true, Warren Buffett-approved number (shown in blue in the chart bellow) is a paltry 91.5! This is also the lowest S&P500 GAAP earnings per share since 2010.
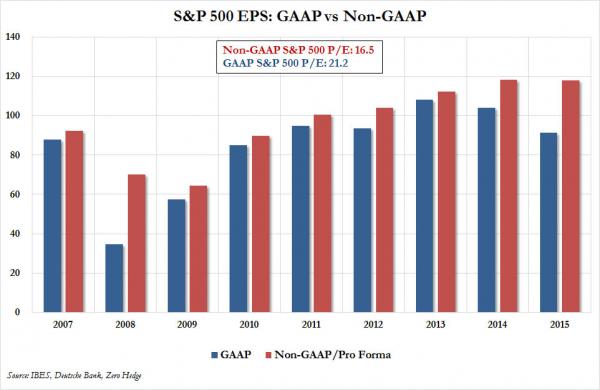
Needless to say, a GAAP P/E above 21 is the highest since the financial crisis.
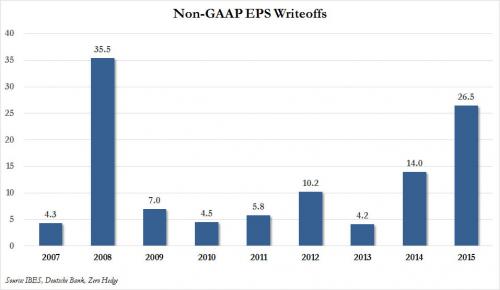
So what is going on here? The chart below showing the amount of EPS “writeoffs” and pro-forma adjustments should explain it. In 2015, 26.5 of the total non-GAAP in S&P earnings, is the result of accounting gimmicks.
Just so there is no confusion: the GAAP to non-GAAP adjustment has nothing to do with the overall deterioration in corporate revenues and declining profitability. The two are parallel, because while both non-GAAP and GAAP EPS are clearly declining, what Wall Street is doing is using every possible contrivance to make the descent appear far less disastrous.
Meanwhile, the addbacks to the S&P’s EPS are now the highest since the 2008 financial crisis, and in nominal dollar terms, are already an all time high. Consider that the market cap of the S&P is $17.7 trillion – this means that using the non-GAAP P/E of 16.5x one gets S&P 2015 earnings of $1.1 trillion, while real, actual earnings amount to just $830 billion. In other words, a record quarter of a trillion dollars in S&P “earnings” is in the form of pro-forma addbacks and other writeoffs which are only considered earnings in the most ridiculous of Wall Street worlds, one which even Warren Buffett is mocking.
This also means that 22.5% of the S&P “value” is the result of “misleading numbers that can deceive investors” in the words of Warren Buffett.
Incidentally, the last time the difference between GAAP and non-GAAP was this vast, the financial system collapsed and had to be rebooted with trillions in taxpayer bailouts at which point GAAP and non-GAAP were roughly identical.
So what does this all mean?
Simple: if using GAAP earnings, and applying the market’s already generous 16.5x non-GAAP P/E, one gets a fair value of the S&P 500 of 1,500, or 25% lower than the recent prints in the S&P 500.
Finally, keep in mind that all of this also excludes the reality that futures earnings, both GAAP and non-GAAP, in Q3 and Q4 are about to be reduced drastically lower, further reducing the E in P/E, and dragging the overall market lower.
What can possibly short-circuit this positive feedback loop which leads to ever lower earnings, and increasingly lower prices? Two years ago we would have said another major central bank intervention or trillions in new Chinese loans. However, with both of these loopholes largely played out – China’s debt/GDP of 350% means that the entire nation is on the brink of a Minsky Moment collapse at any, well, moment, while recent central bank intervention have only led to even greater market volatility – this time around we don’t know what the true answer is. In fact, it just may be that this time around the market will actually have to crash, like it did in 2008 when the GAAP to non-GAAP spread was just as vast, for the great Wall Street “phony earnings” game to start from scratch.
Source: Mind the Non-GAAP: Real S&P Earnings are the lowest Since 2010 – ZeroHedge

