
The inconsistency or unevenness of the economic data is a huge part of the problem. The world wants to move in nice, clean straight lines and nowhere is that more of an assumption than economics. There is some allowance for variation but that is always expected to be minimal. The past four years or so just haven’t seen much deference to convention.
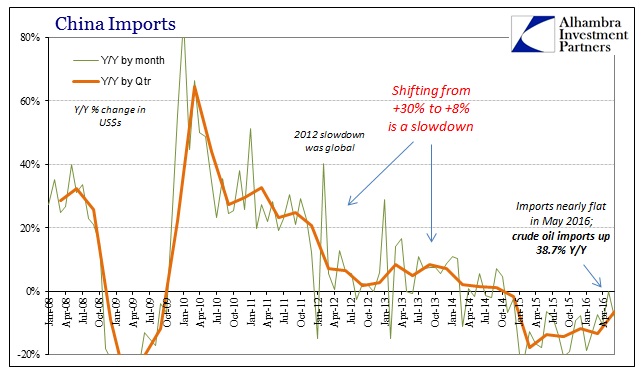
Last month for May 2016, China reported imports that were almost even with May 2015. With revisions this month, the year-over-year figure is just barely negative at -0.1% (with a huge increase in crude oil imports). Even though it was way out of line with prior months, April’s import number was -10.5%, the mainstream wanted so badly to believe it was the start of the full bloom of “stimulus.” But unevenness is just a part of this slowdown and eurodollar decay, meaning there really shouldn’t be much surprise and disappointment when China reported today the import estimate for June 2016 falling back to -8.4%.
For Q2 overall, imports fell “only” 6.5% from Q2 2015, about half the pace of contraction in Q1. Given that Chinese imports declined almost 14% in Q2 2015 from Q2 2014, the current growth rate starts to matter much less from the perspective of time. In other words, imports in Q2 2016 were 19.3% less than Q2 2014, where the worst part of that result, economically speaking, is not the 20% decline but the two years and no turnaround yet indicated.
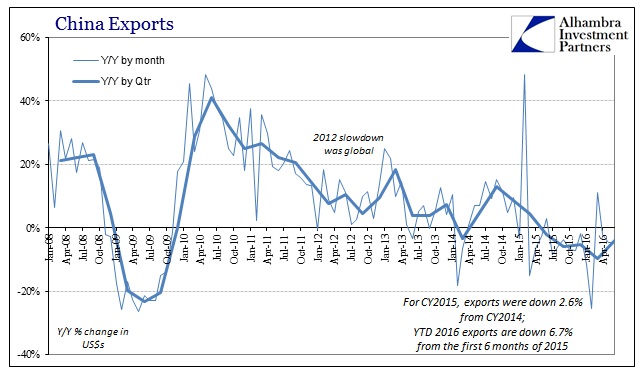
On the export side, the estimate for June 2016 was 4.8% less than June 2015 (following a downward revised -4.7% in May). For the quarter, exports fell almost 4% and again an improvement from the nearly 10% drop in Q1 that was undoubtedly under the heavy influence of global illiquidity. The -4% in Q2 was right in line with the last half of last year, suggesting that the baseline for Chinese participation in global trade is alarmingly still lower even without the negative effects of acute “dollar” pressure.
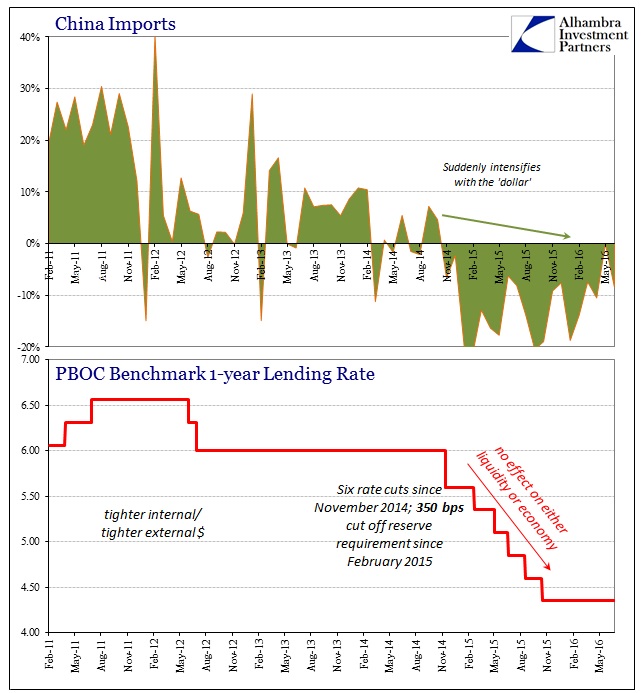
Irregularity of the monthly changes aside, there continues to be a lack of response both internally in China (in the form of imports) and externally in “global demand” from “stimulus” that still remains the dominant policy position (even in orthodox terms suggesting still “accommodation” in the US). Since November 2014, the PBOC has cut its 1-year benchmark lending rate six times, bringing it down from 6% to 4.35% and holding. The Chinese central bank also reduced the bank reserve requirement by a total of 350 bps dating back to last February. And still imports are contracting.
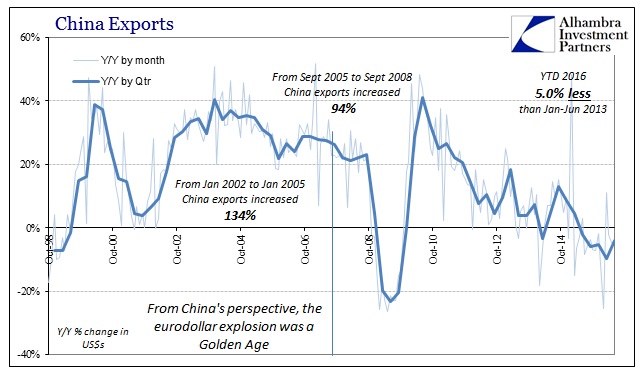
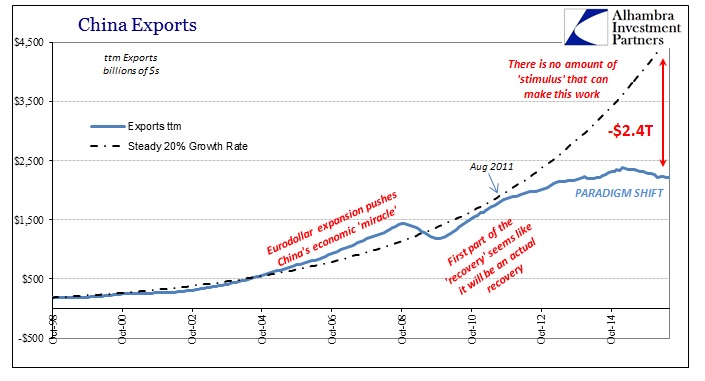
The bigger problem for China is capacity and what financing was expected as that capacity was built – especially in the years just before, during and after the global Great Recession. The entire world and its various policy injections all operated on cyclical assumptions, and so mainstream financial outlets followed them. In China, that meant 20-30% export growth consistently as that was the profit opportunity that “hot money” (meaning eurodollar-based financing) was in pursuit of. It wouldn’t matter if exports in China were actually growing and even growing at double digits in 2016, the hole of opportunity cost is already enormous again with the span of time now being the biggest element.
To fulfill those past financial assumptions would now require growth rates that are simply not realistic. In other words, even if the global economy were moving forward China would still require a financial as well as capacity reckoning to some very serious degree. That the global economy is instead moving backward should have the effect of increasing the risks of that reckoning in terms of its length and depth. It is that very imbalance of risk that has caused this “dollar” drain to begin with.
Consistent with so many economic statistics from all over the world, China’s trade update for June shows that despite what is now normal variation month to month nothing has changed. The slowdown/contraction baseline remains no matter the “stimulus” and that is really the only important piece for analysis. There really is no difference between May’s import estimate of -0.1% and June’s -8.4%; the same interpretation would hold even if May’s estimate had been +8.4%. It’s all the same determined, non-cyclical decay; just ask Brazilians.

