
By Victor Reklaitis at MarketWatch
Watch out because a key stock benchmark is close to a “bearish crossover,” warn chart watchers.
The S&P 500 SPX, +1.46% is not far from having its 10-month moving average cross below its 20-month moving average from above for the first time since 2008, says Jonathan Krinsky at MKM Partners in a note dated Sunday.
There have been just two other such crossovers in the last 22 years, and “both coincided with cyclical bear markets,” cautions Krinsky, MKM’s chief market technician. His note offers the chart below.
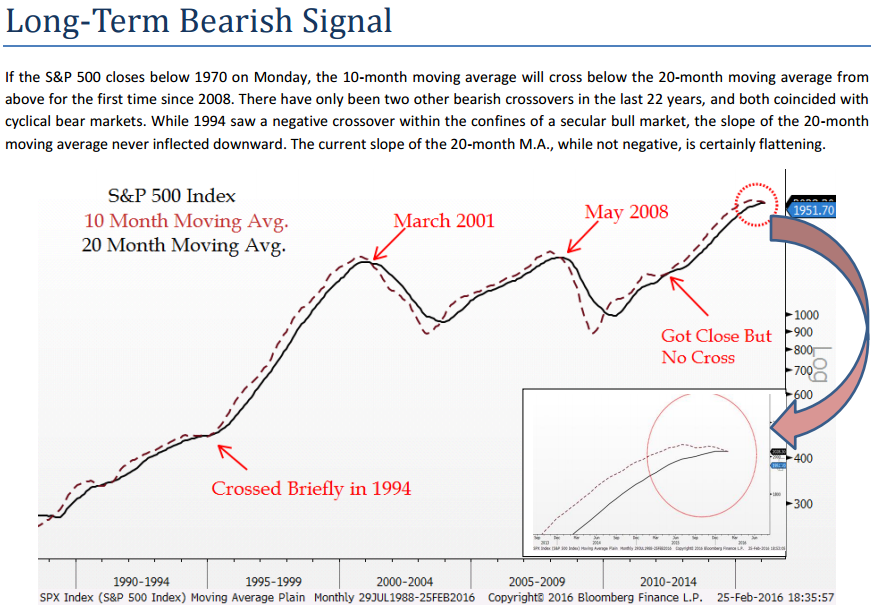
Technical analysts often say that a market’s downward momentum is confirmed with this type of bearish crossover, which happens when a shorter-term moving average drops under a longer-term moving average. In happier times, upward momentum is confirmed when a shorter-term moving average jumps above the longer-term average, as Investopedia has explained.
While the S&P has nabbed two weekly advances in a row and may end with a gain for February, Krinsky writes that he doesn’t think the U.S. stock benchmark is in “a sustainable uptrend” in part because of the bearish crossover that’s close to occurring.
The crossover will have happened if the S&P ends Monday’s session below 1,970, Krinksy adds. The index closed at 1,948.05 on Friday.
720 Global’s Michael Lebowitz flagged the looming bearish crossover as well. “If history proves prophetic, buckle up,” Lebowitz writes, as noted in MarketWatch’s Need to Know column. “Stock prices may be in for a precipitous decline.”
Source: The S&P 500 is Close to Flashing a Bearish Signal it Hasn’t Displayed Since 2008 – MarketWatch

