
This week’s report on “existing home sales” showed that the volume of sales contracts making it to settlement is slowing. At the same time, more contracts are closing successfully than has been usual in past years. The number of December sales contracts has been stagnant since 2012. But closings have continued to trend higher until this year. Now they too have stalled.
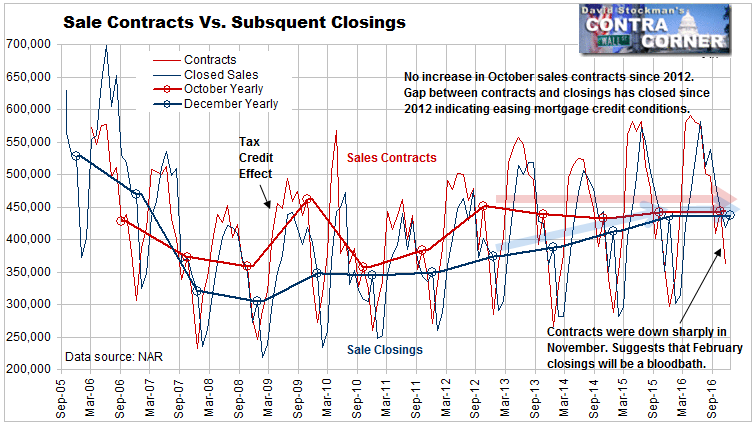
Normally between 5% and 10% of contracts fall through. Over the past year only about 1% of sales haven’t made it to settlement. This suggests an urgency on the part of mortgage lenders to close deals now, before it’s too late. Get the loans on the books, package them up and move them out in pools as MBS sold to bag holding investors.
They accomplish this by loosening underwriting standards. They lower credit score requirements for buyers. They stretch on buyer debt service ratios, allowing borrowers to borrow more than the normal limit of 28% of gross household income. I know that because a long time ago I was a mortgage loan officer.
The banks are also easier on the value of the collateral, often pushing appraisers to raise their value estimates. Most appraisers comply. Those that don’t get no orders from the lenders. I happen to know this because I was one of those appraisers 28 years ago when S&Ls were acting like idiots. That led to a commercial real estate and housing crash between 1989 and 1991.
That housing crash was small potatoes compared with The Great Crash (GHC) of 2007-2011, but at the time it seemed like the end of the world. Plenty of builders and most S&Ls went belly up. Remember the Resolution Trust Corporation? It was the government agency set up to get the bad loans off the books and resolve the busted banks and S&Ls. It actually worked and ended up costing savers and taxpayers nothing as the industry slowly recovered in the 1990s.
The two biggest differences between then and the GHC is, first, that the more recent losses were much bigger. The second, and more important difference is that back in the late 1980s and early 1990s the Federal Government prosecuted the bank criminals. More than a few of them actually did time. Thus deterred, it took a good 15 years for the next bankster crime wave to rear its ugly head.
But this time, deregulation had taken hold and the Fed and US Government had become enamored of the ridiculous idea that the market would take care of bad actors. So those bad actors acted with impunity. The effectively had the regulatory and legislative machinery in their pocket. None of the bigwigs were prosecuted. None have gone to jail. The Justice Department extorted big fines from their banks, but that only tweaked the bottom line, with any losses falling on shareholders, not the bank criminals like Tangelo Mozillo of Countrywide, or John the Con Stumpy of Wells Fargo. There were others too numerous to mention. None of the big banks and mortgage banks were led by men in white hats. But they got off scot free.
So it’s no surprise that only 10 years after the peak of the last bubble, another housing bubble is about to pop and wreak financial havoc. In fact, the commercial real estate bubble today is even worse than the hideous, crime driven bubble of the 1980s. Back then the cap rate was always 10. Today it’s 2. What they have in common is the insane growth assumptions that were and are used in discounted cash flow models to justify prices. But that’s a story for another day.
Existing Home Sale Prices Send Crucial Signal
Meanwhile, price changes in the housing market may have just sent a crucial signal.
The second part of the NAR’s “Existing Home Sales” report covers the median and average prices of homes that went to contract that month. Realtors enter that data in their local MLS databases virtually immediately. I know that because I was one of those Realtors at one time, and as an appraiser I used that MLS closed sales data, not just the individual sales data but the aggregated data published at the end of the month. It was good data.
Having been there and done that makes the raw data a lot more understandable. There’s always an interesting and important background story to those lines on a graph. They don’t merely depict trends. Those lines have a back story. They have meaning. When we’ve seen these things before in a real live way, we get a pretty good understanding of what the lines on the graph tell us about current conditions and what to expect next.
There are a number of price data services. There’s the widely followed Case Shiller Index (CSI) that is so popular with the media. It’s virtually useless. It has a built in 5 1/2 month lag, and its methodology suppresses upward price changes. The resulting lag got so bad that in 2013, with virtually no notice, S&P and Dow Jones, which owned the CSI then, stopped reporting the CSI 10 Cities and 20 Cities Composites.
Instead they made up a completely new index called the CS National Index and started reporting it with no notice of the change. The new index uses less statistical manipulation and reports a number that’s closer to the actual nationwide average. But it still has the built in 5 1/2 month lag.
The NAR data has the advantage of being comprehensive and timely. It compiles the data from all MLS’s all over the country. The MLS data reflects the contract prices from the immediately prior month. That’s as near as you can get to real time in this business.
The NAR reports the median and average sale prices on a seasonally adjusted basis, which is useless. It is useless because the NAR also reports the average and median prices on an actual, not seasonally adjusted basis. Why would you use fake, artificially smoothed data when you have the real thing? So what if there’s seasonality. The trend is clearly visible, and there’s no smoothing that can obscure trend change as it is actually happening.
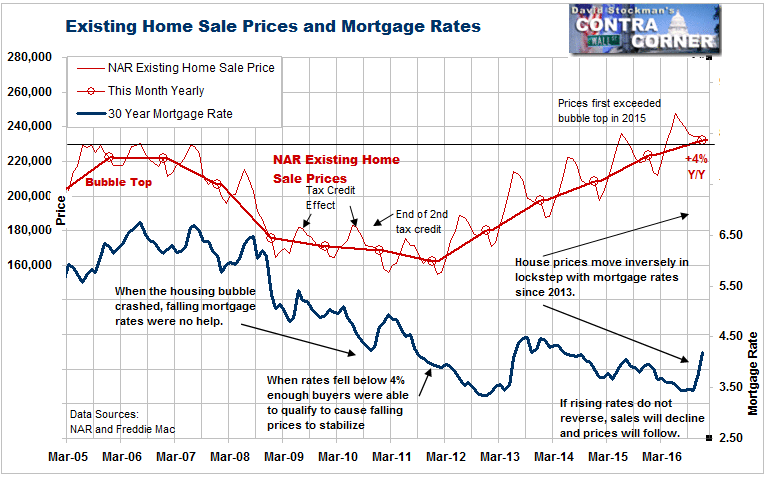
In 2015, median US house prices inflated at an average annual rate of a sizzling 6.4%. In 2016 existing home price inflation averaged 5.5%. But it was accelerating toward the end of the year. In September, October, and November, the annual inflation rate was 6.1%, 6.8%, and 6.5% respectively.
But then in November mortgage rates soared, causing buyers’ monthly payments to ratchet higher. In December, the annual rate of house price inflation suddenly dropped to 4%. The last time price momentum fell that sharply was before the housing price crash bottomed in 2011. This December’s performance was the worst since the price rebound began in 2012. It’s a sign that mortgage rates are beginning to bite.
Another way of judging the momentum of housing inflation is to consider the month to month change. December prices actually fell 0.9% from November. Sale prices do exhibit seasonal behavior but declines in December are the exception not the rule. During the rebound since the housing crash price low in 2011, prices have never declined in December! The current 0.9% decline compares with a 1.5% increase in December 2015. The average December change between 2012 and 2015 was an increase of 0.9%. Any way you slice it, last month’s price performance looks ominous.
If buyers reach the limit of what they can afford to pay… If lenders have made credit terms as easy as they can… If appraisers are stretching appraisal values beyond credulity… If virtually all the deals that have been written on paper make it to closing, that’s not amore. It’s a housing market that has once again become dangerously frothy.
Rising mortgage rates will be an absolute killer under these conditions. If the 10 year Treasury yield breaks through 2.6%, that yield is likely to soar virtually immediately to 3%, with further increases likely. Mortgage rates will go with it and the home resale market will freeze. Sales will simply stop and that will be followed by a price crash.
Here is the key. As long as they can hold the 10 year below 2.6%, housing can limp along with little or no increase in sales, and little or no more home price inflation. But if those rates start rising, it’s game over.
Don’t wait for Case Shiller to show you that price increases are slowing. It won’t show up in their data until June. By then it will be too late. If you have been thinking of selling your house, now is the time. You’ll have the benefit of favorable spring time seasonality only if rates don’t rise. If they do, yesterday wouldn’t be soon enough.
If rates do start to ratchet up again, housing related stocks and ETFs should be good short sale opportunities for a very big swing move. Right now they’re acting as if nothing could go wrong. That’s the most unlikely scenario.
Lee first reported in 2002 that Fed actions were driving US stock prices. He has tracked and reported on that relationship for his subscribers ever since. Try Lee’s groundbreaking reports on the Fed and the Monetary forces that drive market trends for 3 months risk free, with a full money back guarantee. Be in the know. Subscribe now, risk free!

