
The Commerce Department reported today that sales of newly built homes posted a seasonally adjusted month to month decline of 7.6% to an annualized rate of 609,000. This was near the consensus guess of economists of 602,000 according to the Wall Street Journal. In terms of the game of pin the tail on the donkey-economists it was a non-event.
The Commerce Department also reported that the August headline number was up 20.6% year to year. That sounds good until you look at the actual data.
The actual, unmanipulated figures showed a total of 50,000 new homes sold in August, compared with 57,000 in July, a drop of -12.3%. That was much worse than the typical month to month decline in August. Last year the August drop was -4.7% month to month. The average August decline for the prior 10 years was -5.6%. In fact, this was the largest August month to month decline in history, going back to 1963 when the Federal Government began collecting this data.
This August had the advantage of 2 more business days than August 2015 possibly giving the August numbers a boost. New home sales are counted at the time they go under contract. While sales contracts can be signed on weekends in this business, it’s the exception. The numbers were the worst in history, even with that boost. In cases like this, economists usually blame the weather. I guess it was too hot to buy houses. Global warming, yeah, that’s the ticket!
The year to year change gives a different perspective. That was still up 22%, which sounds good until you look at the fact that the sales rate remains near the lowest levels in history. At the same time mortgage rates are at the lowest level in history.
The 22% year to year increase compares with an annual rate of change in July of +32.6%. The last time there was a larger year to year increase in July was 1983. That was coming off the 1982 recession low. Before that was 1971. We have to wonder if this July was the blowoff phase of this much ballyhooed “recovery.” If so, it’s all downhill from here.
While the market had 2 more years of modest gains after that move in 1983, sales trended down for 6 years from 1985 to 1991 The 1971 gain preceded the sales peak by a year. That was followed by a crash into 1974.
If July was the blowoff, then the sharp drop in sales in August suggests that it has exhausted itself.
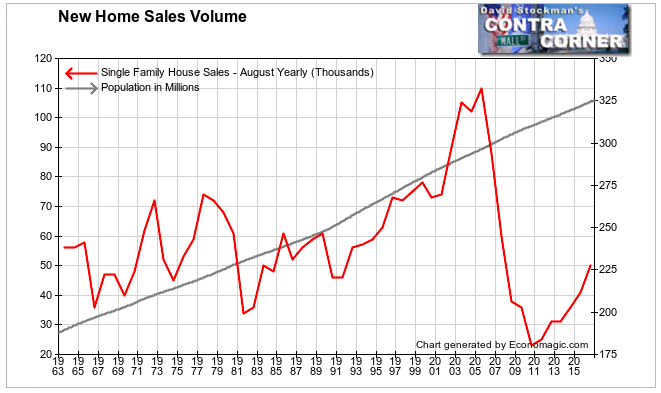
Meanwhile total August sales are barely above the level of the 1992 recession. The current level may appear to be in a normal range excluding the massive housing bubble from 2001 to 2006. However, it does not take into account the 75% increase in population since this data was first collected in 1963.
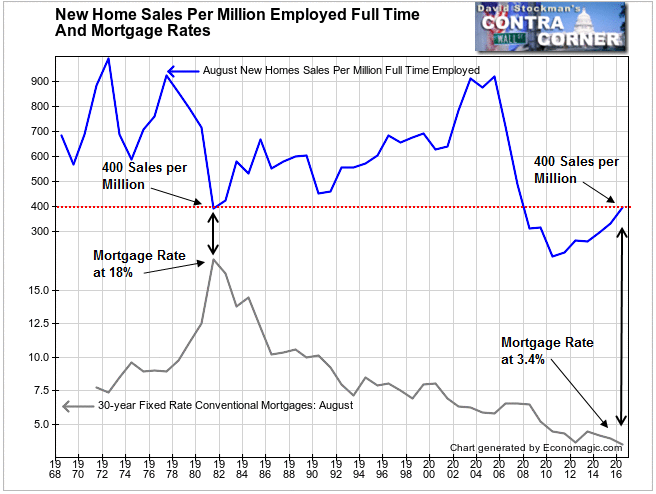
An interesting way of accounting for population growth is on the basis of sales per million full time workers. On that basis, the sales rate has failed to return even to the level of the 1991 recession low. Sales are only back to 400 sales per million full time workers, the same level they fell to at the bottom of the 1981-82 recession. At that time, mortgage rates were at 18%. Today, they are at 3.5%.
Meanwhile data on the median sale price is also throwing up a red flag. The median sale price in August was $284,000, down 3.1% from July. Excluding years affected by the hangover from the Federal Government’s tax credits to home buyers, this was the worst August drop since 2008, when the housing crash was in its worst phase.
The year to year price change in August was a decline of -5.4%. That was the worst August year to year decline since 2012, when the market was still in the process of probing for a bottom. This and the decline in sales volume could be signs that the market is topping out as the affordability problem begins to bite. Weak income growth and high prices could be combining to cut into demand.
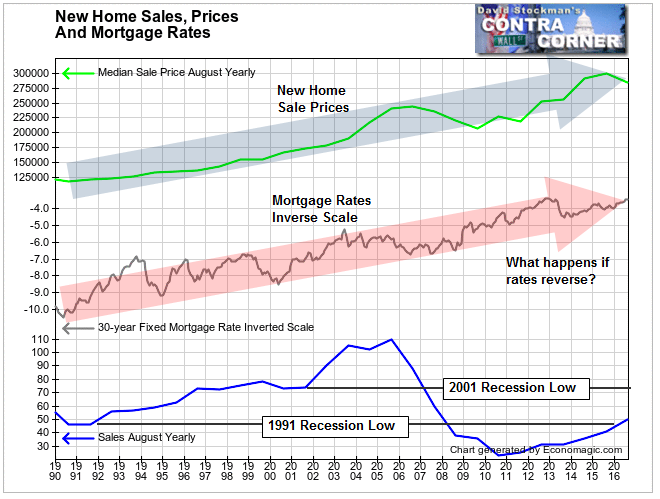
One month does not a trend make, but considering the long term relationship between rising prices and falling mortgage rates, it’s clear that the Fed has painted itself into a corner with its pursuit of ZIRP ad infinitum.
The median price of a new house has risen by 38% since August 2009. The reciprocal of the mortgage rate, that is, the price of a dollar of mortgage interest has risen by 51% over the same period. This is not a fluke. Prices increase as rates fall. The correlation between falling mortgage rates and rising house prices has been relatively constant since 1990. Mortgage rates were 190% higher in 1990 than they are today. New house prices are 140% higher today than they were in 1990.
There’s an obvious cause and effect relationship. As mortgage interest declines, buyers can afford to borrow more. This is what financialization has been all about. But it has its limits, and that limit has probably been reached.
Given the relationship between mortgage rates and home prices, the Fed can hardly afford to allow rates to rise. Its mistake was in allowing rates to fall below previous historic norms. After all, the rate of sales today is exactly where it was in 2008 when mortgage rates were around 6%. Had the Fed stopped forcing rates lower at that point, sales volume would probably have eventually stabilized at this level anyway, and prices would be lower.
Therein lies the problem. In 2008 most mortgages were underwater. Rather than allow a cleansing of the bad actors in the financial system, the Fed committed to reinflating prices, regardless of the long term consequences.
The idea that the US economy would not have recovered without the Fed pushing rates to zero is absurd. The US economy has ALWAYS recovered from recession, regardless of the fact that interest rates were a good deal higher in each recovery than they are now. To believe that the economy could not recover without interest rates being pushed to zero and held there is to close your eyes to the lessons of history. A little more pain then would have left the economy in much better shape today. Instead, the US economy is now crippled and on permanent life support because it has never been allowed to exhale and rid itself of toxins.
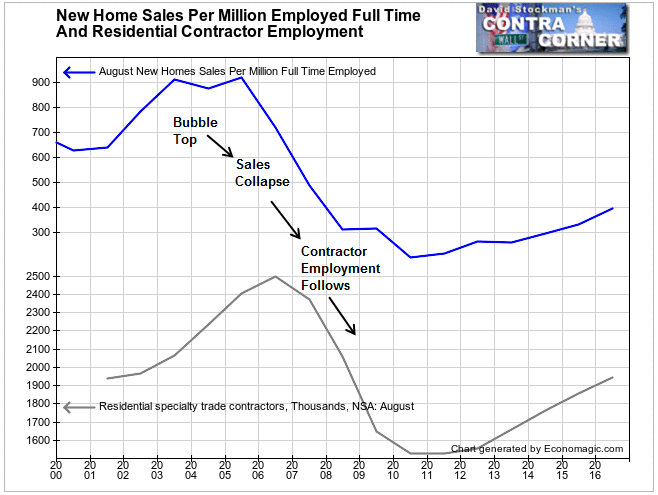
Now we are boxed in. The housing industry epitomizes the problem. There are 2 million workers in residential contracting according to the BLS. They earn median salaries of around $51,000 per year. When housing bubbles peak, the first thing to disappear are sales. Prices follow. Then employment. Any rise in rates at this point would be a two headed monster. One head would cause millions of homes to fall below their mortgage principal as rates rise and prices recede. The other would be another blow to employment, with hundreds of thousands of good paying construction jobs going by the wayside.
Even with the massive subsidy created by record low mortgage rates, the housing market appears to be teetering at yet another bubble top. In spite of rates at all time lows in August the market suddenly weakened. This could be an indication that demand is exhausted.
The market has had the tailwind of falling mortgage rates for 35 years. If you believe that the Fed, the ECB, and the BoJ can continue QE forever, then you can believe that mortgage rates will continue to fall and keep this game going.
That belief would require that major investors around the world would also be willing to continue making that bet indefinitely. If they’re not, they’ll begin to sell their fixed income paper. They are now sitting on massive bubble profits. In all bubbles, at some point a few big players start to sell and the tide turns. Is this central bank sponsored fixed income bubble different? I don’t think so. Sooner or later, fixed income yields will start to rise. This will force a major adjustment in the housing market, in financial markets, and in the economy. Central banks will be powerless to stop it.
Lee Adler first reported in 2002 that Fed actions were driving US stock prices. He has tracked and reported on that relationship for his subscribers ever since. Try Lee’s groundbreaking reports on the Fed and the forces that drive Macro Liquidity for 3 months risk free, with a full money back guarantee.

